Nigerian vs Immigrants from Armenia 10th Grade
COMPARE
Nigerian
Immigrants from Armenia
10th Grade
10th Grade Comparison
Nigerians
Immigrants from Armenia
93.1%
10TH GRADE
4.2/ 100
METRIC RATING
238th/ 347
METRIC RANK
89.9%
10TH GRADE
0.0/ 100
METRIC RATING
324th/ 347
METRIC RANK
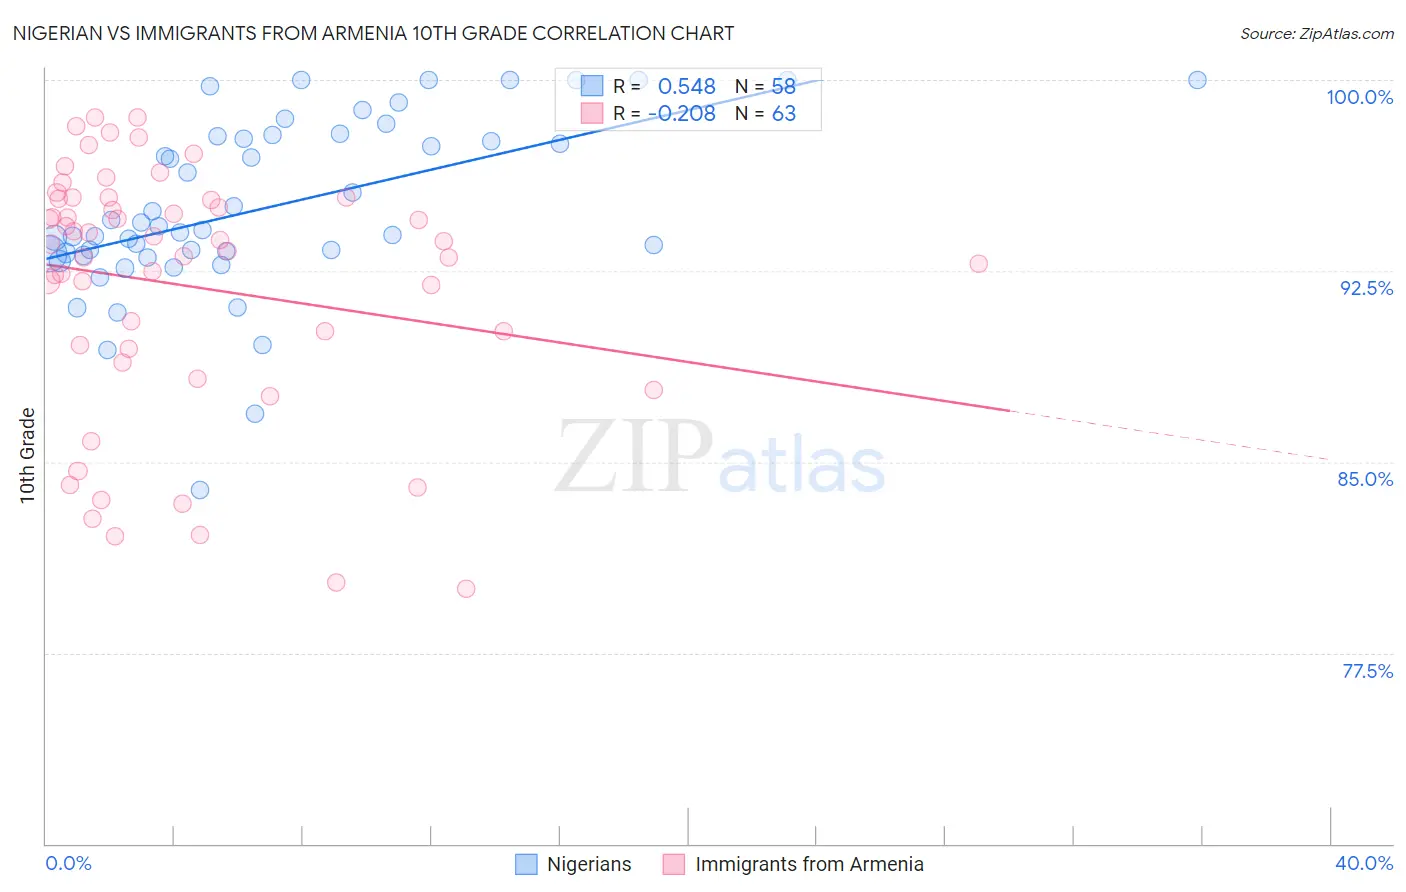
Nigerian vs Immigrants from Armenia 10th Grade Correlation Chart
The statistical analysis conducted on geographies consisting of 332,724,627 people shows a substantial positive correlation between the proportion of Nigerians and percentage of population with at least 10th grade education in the United States with a correlation coefficient (R) of 0.548 and weighted average of 93.1%. Similarly, the statistical analysis conducted on geographies consisting of 97,657,339 people shows a weak negative correlation between the proportion of Immigrants from Armenia and percentage of population with at least 10th grade education in the United States with a correlation coefficient (R) of -0.208 and weighted average of 89.9%, a difference of 3.6%.
10th Grade Correlation Summary
| Measurement | Nigerian | Immigrants from Armenia |
| Minimum | 83.9% | 80.0% |
| Maximum | 100.0% | 98.5% |
| Range | 16.1% | 18.5% |
| Mean | 95.0% | 91.9% |
| Median | 94.2% | 93.5% |
| Interquartile 25% (IQ1) | 93.2% | 89.4% |
| Interquartile 75% (IQ3) | 97.8% | 95.4% |
| Interquartile Range (IQR) | 4.6% | 5.9% |
| Standard Deviation (Sample) | 3.5% | 4.9% |
| Standard Deviation (Population) | 3.4% | 4.9% |
Similar Demographics by 10th Grade
Demographics Similar to Nigerians by 10th Grade
In terms of 10th grade, the demographic groups most similar to Nigerians are Costa Rican (93.1%, a difference of 0.0%), Immigrants from Hong Kong (93.1%, a difference of 0.0%), Immigrants from Panama (93.1%, a difference of 0.010%), African (93.1%, a difference of 0.020%), and Afghan (93.1%, a difference of 0.020%).
| Demographics | Rating | Rank | 10th Grade |
| South American Indians | 4.9 /100 | #231 | Tragic 93.1% |
| Bahamians | 4.9 /100 | #232 | Tragic 93.1% |
| Comanche | 4.9 /100 | #233 | Tragic 93.1% |
| Sub-Saharan Africans | 4.7 /100 | #234 | Tragic 93.1% |
| Africans | 4.6 /100 | #235 | Tragic 93.1% |
| Afghans | 4.5 /100 | #236 | Tragic 93.1% |
| Immigrants | Panama | 4.3 /100 | #237 | Tragic 93.1% |
| Nigerians | 4.2 /100 | #238 | Tragic 93.1% |
| Costa Ricans | 4.2 /100 | #239 | Tragic 93.1% |
| Immigrants | Hong Kong | 4.2 /100 | #240 | Tragic 93.1% |
| Immigrants | Somalia | 2.7 /100 | #241 | Tragic 93.0% |
| Immigrants | Cameroon | 2.6 /100 | #242 | Tragic 93.0% |
| Senegalese | 2.4 /100 | #243 | Tragic 93.0% |
| Spanish Americans | 2.1 /100 | #244 | Tragic 92.9% |
| Uruguayans | 1.8 /100 | #245 | Tragic 92.9% |
Demographics Similar to Immigrants from Armenia by 10th Grade
In terms of 10th grade, the demographic groups most similar to Immigrants from Armenia are Puerto Rican (89.8%, a difference of 0.020%), Central American Indian (89.7%, a difference of 0.20%), Immigrants from Belize (90.1%, a difference of 0.22%), Tohono O'odham (90.1%, a difference of 0.31%), and Houma (90.2%, a difference of 0.32%).
| Demographics | Rating | Rank | 10th Grade |
| Immigrants | Ecuador | 0.0 /100 | #317 | Tragic 90.4% |
| Immigrants | Cuba | 0.0 /100 | #318 | Tragic 90.2% |
| Nicaraguans | 0.0 /100 | #319 | Tragic 90.2% |
| Houma | 0.0 /100 | #320 | Tragic 90.2% |
| Belizeans | 0.0 /100 | #321 | Tragic 90.2% |
| Tohono O'odham | 0.0 /100 | #322 | Tragic 90.1% |
| Immigrants | Belize | 0.0 /100 | #323 | Tragic 90.1% |
| Immigrants | Armenia | 0.0 /100 | #324 | Tragic 89.9% |
| Puerto Ricans | 0.0 /100 | #325 | Tragic 89.8% |
| Central American Indians | 0.0 /100 | #326 | Tragic 89.7% |
| Immigrants | Nicaragua | 0.0 /100 | #327 | Tragic 89.5% |
| Immigrants | Cabo Verde | 0.0 /100 | #328 | Tragic 89.5% |
| Dominicans | 0.0 /100 | #329 | Tragic 89.4% |
| Immigrants | Yemen | 0.0 /100 | #330 | Tragic 89.1% |
| Mexican American Indians | 0.0 /100 | #331 | Tragic 89.0% |