Immigrants from Russia vs Immigrants from Armenia 10th Grade
COMPARE
Immigrants from Russia
Immigrants from Armenia
10th Grade
10th Grade Comparison
Immigrants from Russia
Immigrants from Armenia
94.3%
10TH GRADE
92.4/ 100
METRIC RATING
132nd/ 347
METRIC RANK
89.9%
10TH GRADE
0.0/ 100
METRIC RATING
324th/ 347
METRIC RANK
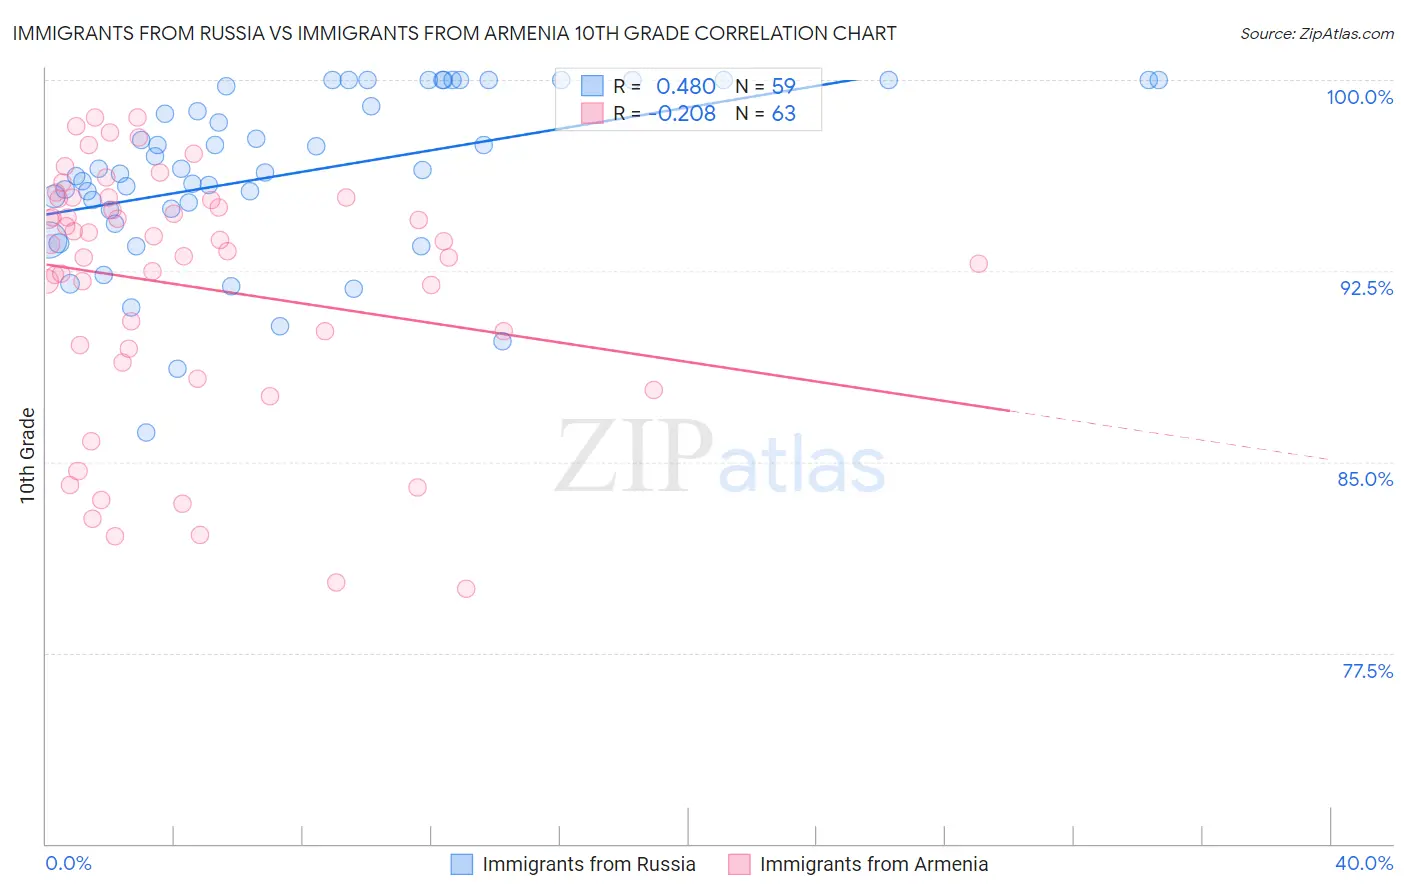
Immigrants from Russia vs Immigrants from Armenia 10th Grade Correlation Chart
The statistical analysis conducted on geographies consisting of 347,948,494 people shows a moderate positive correlation between the proportion of Immigrants from Russia and percentage of population with at least 10th grade education in the United States with a correlation coefficient (R) of 0.480 and weighted average of 94.3%. Similarly, the statistical analysis conducted on geographies consisting of 97,657,339 people shows a weak negative correlation between the proportion of Immigrants from Armenia and percentage of population with at least 10th grade education in the United States with a correlation coefficient (R) of -0.208 and weighted average of 89.9%, a difference of 4.9%.
10th Grade Correlation Summary
| Measurement | Immigrants from Russia | Immigrants from Armenia |
| Minimum | 86.2% | 80.0% |
| Maximum | 100.0% | 98.5% |
| Range | 13.8% | 18.5% |
| Mean | 96.3% | 91.9% |
| Median | 96.5% | 93.5% |
| Interquartile 25% (IQ1) | 94.9% | 89.4% |
| Interquartile 75% (IQ3) | 100.0% | 95.4% |
| Interquartile Range (IQR) | 5.1% | 5.9% |
| Standard Deviation (Sample) | 3.3% | 4.9% |
| Standard Deviation (Population) | 3.3% | 4.9% |
Similar Demographics by 10th Grade
Demographics Similar to Immigrants from Russia by 10th Grade
In terms of 10th grade, the demographic groups most similar to Immigrants from Russia are Iroquois (94.3%, a difference of 0.010%), Immigrants from Greece (94.3%, a difference of 0.010%), Immigrants from Eastern Europe (94.3%, a difference of 0.010%), Creek (94.2%, a difference of 0.010%), and Osage (94.2%, a difference of 0.020%).
| Demographics | Rating | Rank | 10th Grade |
| Americans | 94.4 /100 | #125 | Exceptional 94.3% |
| Immigrants | Iran | 94.4 /100 | #126 | Exceptional 94.3% |
| Israelis | 93.8 /100 | #127 | Exceptional 94.3% |
| Potawatomi | 93.6 /100 | #128 | Exceptional 94.3% |
| Iroquois | 92.8 /100 | #129 | Exceptional 94.3% |
| Immigrants | Greece | 92.7 /100 | #130 | Exceptional 94.3% |
| Immigrants | Eastern Europe | 92.5 /100 | #131 | Exceptional 94.3% |
| Immigrants | Russia | 92.4 /100 | #132 | Exceptional 94.3% |
| Creek | 91.9 /100 | #133 | Exceptional 94.2% |
| Osage | 91.7 /100 | #134 | Exceptional 94.2% |
| Immigrants | Korea | 91.3 /100 | #135 | Exceptional 94.2% |
| Shoshone | 90.8 /100 | #136 | Exceptional 94.2% |
| Arapaho | 90.5 /100 | #137 | Exceptional 94.2% |
| Immigrants | Sri Lanka | 89.9 /100 | #138 | Excellent 94.2% |
| Immigrants | Bosnia and Herzegovina | 89.4 /100 | #139 | Excellent 94.2% |
Demographics Similar to Immigrants from Armenia by 10th Grade
In terms of 10th grade, the demographic groups most similar to Immigrants from Armenia are Puerto Rican (89.8%, a difference of 0.020%), Central American Indian (89.7%, a difference of 0.20%), Immigrants from Belize (90.1%, a difference of 0.22%), Tohono O'odham (90.1%, a difference of 0.31%), and Houma (90.2%, a difference of 0.32%).
| Demographics | Rating | Rank | 10th Grade |
| Immigrants | Ecuador | 0.0 /100 | #317 | Tragic 90.4% |
| Immigrants | Cuba | 0.0 /100 | #318 | Tragic 90.2% |
| Nicaraguans | 0.0 /100 | #319 | Tragic 90.2% |
| Houma | 0.0 /100 | #320 | Tragic 90.2% |
| Belizeans | 0.0 /100 | #321 | Tragic 90.2% |
| Tohono O'odham | 0.0 /100 | #322 | Tragic 90.1% |
| Immigrants | Belize | 0.0 /100 | #323 | Tragic 90.1% |
| Immigrants | Armenia | 0.0 /100 | #324 | Tragic 89.9% |
| Puerto Ricans | 0.0 /100 | #325 | Tragic 89.8% |
| Central American Indians | 0.0 /100 | #326 | Tragic 89.7% |
| Immigrants | Nicaragua | 0.0 /100 | #327 | Tragic 89.5% |
| Immigrants | Cabo Verde | 0.0 /100 | #328 | Tragic 89.5% |
| Dominicans | 0.0 /100 | #329 | Tragic 89.4% |
| Immigrants | Yemen | 0.0 /100 | #330 | Tragic 89.1% |
| Mexican American Indians | 0.0 /100 | #331 | Tragic 89.0% |