New Zealander vs Spaniard 11th Grade
COMPARE
New Zealander
Spaniard
11th Grade
11th Grade Comparison
New Zealanders
Spaniards
94.0%
11TH GRADE
99.9/ 100
METRIC RATING
57th/ 347
METRIC RANK
92.5%
11TH GRADE
46.9/ 100
METRIC RATING
176th/ 347
METRIC RANK
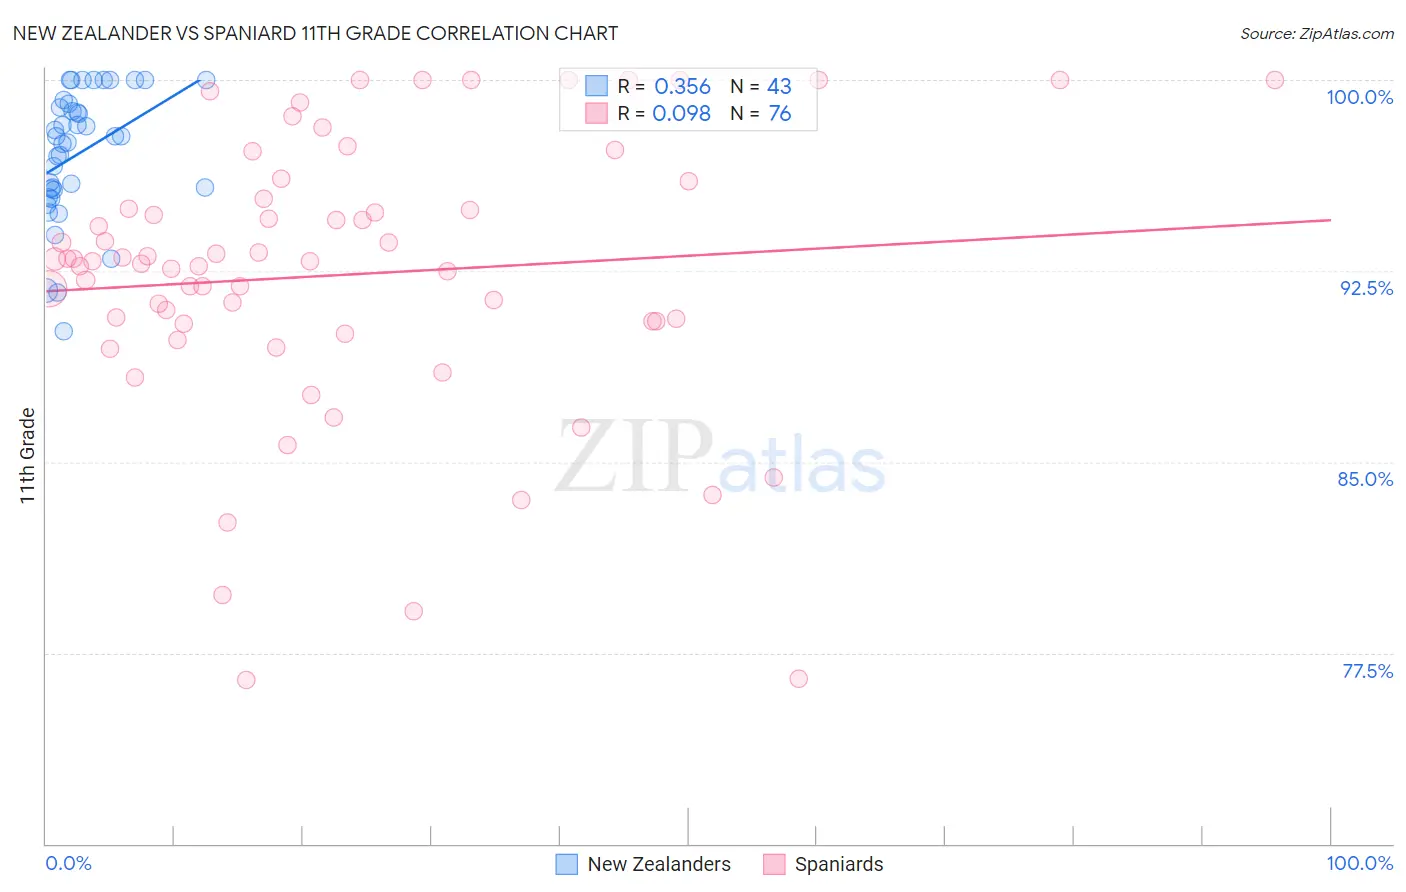
New Zealander vs Spaniard 11th Grade Correlation Chart
The statistical analysis conducted on geographies consisting of 106,912,053 people shows a mild positive correlation between the proportion of New Zealanders and percentage of population with at least 11th grade education in the United States with a correlation coefficient (R) of 0.356 and weighted average of 94.0%. Similarly, the statistical analysis conducted on geographies consisting of 443,545,794 people shows a slight positive correlation between the proportion of Spaniards and percentage of population with at least 11th grade education in the United States with a correlation coefficient (R) of 0.098 and weighted average of 92.5%, a difference of 1.6%.
11th Grade Correlation Summary
| Measurement | New Zealander | Spaniard |
| Minimum | 90.1% | 76.4% |
| Maximum | 100.0% | 100.0% |
| Range | 9.9% | 23.6% |
| Mean | 97.1% | 92.3% |
| Median | 97.8% | 92.9% |
| Interquartile 25% (IQ1) | 95.7% | 90.5% |
| Interquartile 75% (IQ3) | 99.1% | 95.1% |
| Interquartile Range (IQR) | 3.4% | 4.6% |
| Standard Deviation (Sample) | 2.5% | 5.4% |
| Standard Deviation (Population) | 2.5% | 5.4% |
Similar Demographics by 11th Grade
Demographics Similar to New Zealanders by 11th Grade
In terms of 11th grade, the demographic groups most similar to New Zealanders are French Canadian (94.0%, a difference of 0.0%), Iranian (94.0%, a difference of 0.0%), Bhutanese (94.0%, a difference of 0.0%), Okinawan (94.0%, a difference of 0.0%), and Immigrants from North America (94.0%, a difference of 0.010%).
| Demographics | Rating | Rank | 11th Grade |
| French | 99.9 /100 | #50 | Exceptional 94.1% |
| Turks | 99.9 /100 | #51 | Exceptional 94.0% |
| Immigrants | Canada | 99.9 /100 | #52 | Exceptional 94.0% |
| Immigrants | Australia | 99.9 /100 | #53 | Exceptional 94.0% |
| Immigrants | North America | 99.9 /100 | #54 | Exceptional 94.0% |
| Czechoslovakians | 99.9 /100 | #55 | Exceptional 94.0% |
| French Canadians | 99.9 /100 | #56 | Exceptional 94.0% |
| New Zealanders | 99.9 /100 | #57 | Exceptional 94.0% |
| Iranians | 99.9 /100 | #58 | Exceptional 94.0% |
| Bhutanese | 99.8 /100 | #59 | Exceptional 94.0% |
| Okinawans | 99.8 /100 | #60 | Exceptional 94.0% |
| Immigrants | Belgium | 99.8 /100 | #61 | Exceptional 94.0% |
| Austrians | 99.8 /100 | #62 | Exceptional 94.0% |
| Ukrainians | 99.8 /100 | #63 | Exceptional 94.0% |
| Immigrants | Sweden | 99.8 /100 | #64 | Exceptional 93.9% |
Demographics Similar to Spaniards by 11th Grade
In terms of 11th grade, the demographic groups most similar to Spaniards are Shoshone (92.5%, a difference of 0.020%), Guamanian/Chamorro (92.5%, a difference of 0.020%), Asian (92.5%, a difference of 0.030%), Sudanese (92.5%, a difference of 0.030%), and Immigrants from Pakistan (92.5%, a difference of 0.050%).
| Demographics | Rating | Rank | 11th Grade |
| Immigrants | Albania | 57.8 /100 | #169 | Average 92.6% |
| Immigrants | Northern Africa | 57.3 /100 | #170 | Average 92.6% |
| Laotians | 54.4 /100 | #171 | Average 92.6% |
| Immigrants | Pakistan | 52.3 /100 | #172 | Average 92.5% |
| Indians (Asian) | 51.5 /100 | #173 | Average 92.5% |
| Asians | 50.0 /100 | #174 | Average 92.5% |
| Shoshone | 48.9 /100 | #175 | Average 92.5% |
| Spaniards | 46.9 /100 | #176 | Average 92.5% |
| Guamanians/Chamorros | 45.0 /100 | #177 | Average 92.5% |
| Sudanese | 43.4 /100 | #178 | Average 92.5% |
| Creek | 40.9 /100 | #179 | Average 92.4% |
| Inupiat | 40.7 /100 | #180 | Average 92.4% |
| Cherokee | 40.7 /100 | #181 | Average 92.4% |
| Immigrants | Morocco | 38.6 /100 | #182 | Fair 92.4% |
| Immigrants | Malaysia | 37.6 /100 | #183 | Fair 92.4% |