Ugandan vs Spaniard 11th Grade
COMPARE
Ugandan
Spaniard
11th Grade
11th Grade Comparison
Ugandans
Spaniards
92.9%
11TH GRADE
81.4/ 100
METRIC RATING
143rd/ 347
METRIC RANK
92.5%
11TH GRADE
46.9/ 100
METRIC RATING
176th/ 347
METRIC RANK
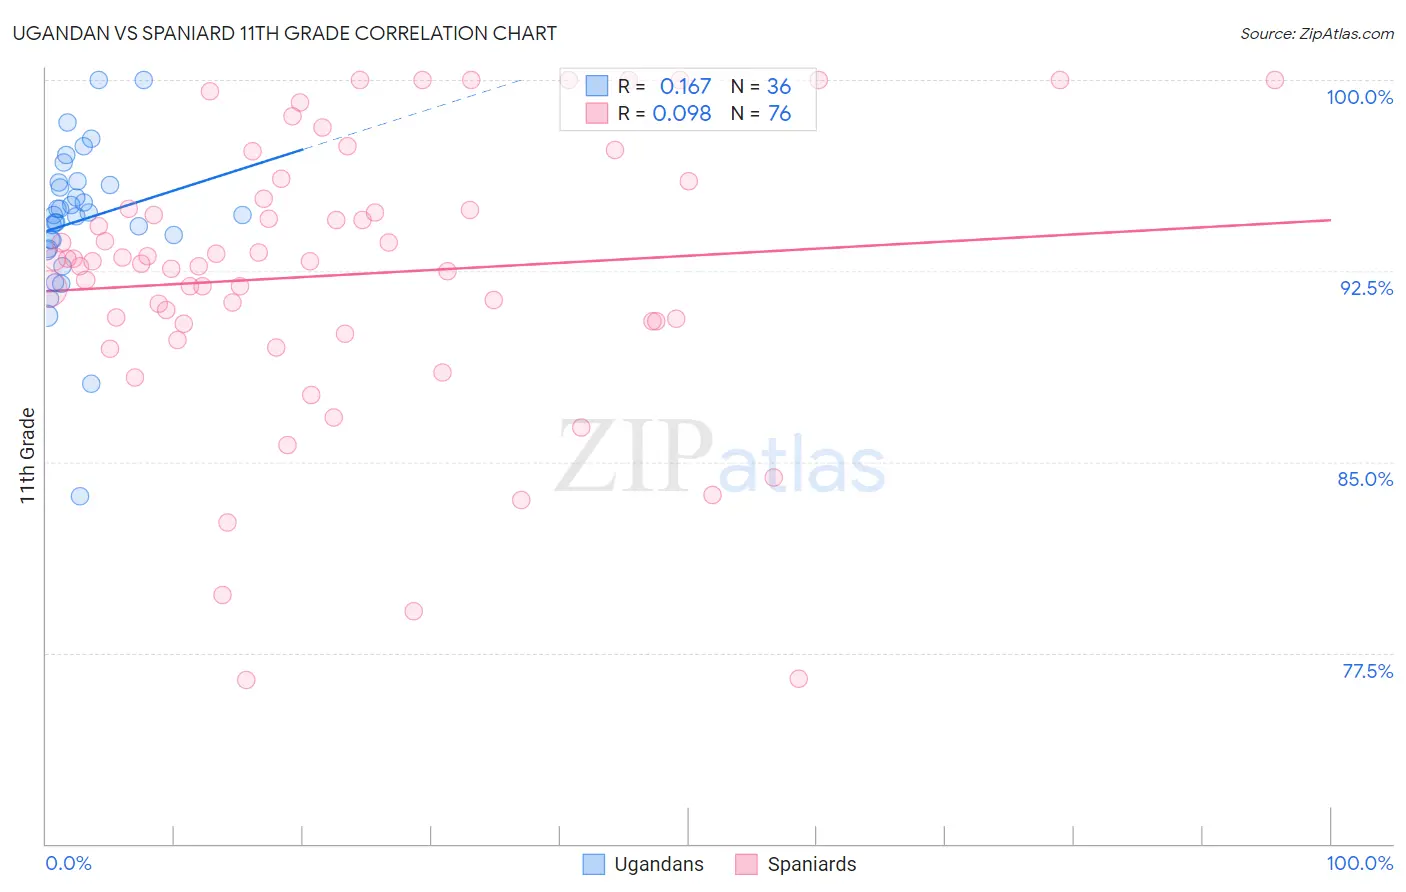
Ugandan vs Spaniard 11th Grade Correlation Chart
The statistical analysis conducted on geographies consisting of 93,991,892 people shows a poor positive correlation between the proportion of Ugandans and percentage of population with at least 11th grade education in the United States with a correlation coefficient (R) of 0.167 and weighted average of 92.9%. Similarly, the statistical analysis conducted on geographies consisting of 443,545,794 people shows a slight positive correlation between the proportion of Spaniards and percentage of population with at least 11th grade education in the United States with a correlation coefficient (R) of 0.098 and weighted average of 92.5%, a difference of 0.39%.
11th Grade Correlation Summary
| Measurement | Ugandan | Spaniard |
| Minimum | 83.7% | 76.4% |
| Maximum | 100.0% | 100.0% |
| Range | 16.3% | 23.6% |
| Mean | 94.5% | 92.3% |
| Median | 94.7% | 92.9% |
| Interquartile 25% (IQ1) | 93.5% | 90.5% |
| Interquartile 75% (IQ3) | 95.9% | 95.1% |
| Interquartile Range (IQR) | 2.4% | 4.6% |
| Standard Deviation (Sample) | 3.0% | 5.4% |
| Standard Deviation (Population) | 3.0% | 5.4% |
Similar Demographics by 11th Grade
Demographics Similar to Ugandans by 11th Grade
In terms of 11th grade, the demographic groups most similar to Ugandans are Kenyan (92.9%, a difference of 0.010%), Assyrian/Chaldean/Syriac (92.8%, a difference of 0.020%), Venezuelan (92.9%, a difference of 0.030%), Chilean (92.9%, a difference of 0.030%), and Pakistani (92.8%, a difference of 0.030%).
| Demographics | Rating | Rank | 11th Grade |
| Cree | 85.9 /100 | #136 | Excellent 92.9% |
| Arabs | 85.4 /100 | #137 | Excellent 92.9% |
| Immigrants | Brazil | 85.1 /100 | #138 | Excellent 92.9% |
| Crow | 84.1 /100 | #139 | Excellent 92.9% |
| Venezuelans | 83.4 /100 | #140 | Excellent 92.9% |
| Chileans | 83.0 /100 | #141 | Excellent 92.9% |
| Kenyans | 82.0 /100 | #142 | Excellent 92.9% |
| Ugandans | 81.4 /100 | #143 | Excellent 92.9% |
| Assyrians/Chaldeans/Syriacs | 80.5 /100 | #144 | Excellent 92.8% |
| Pakistanis | 79.6 /100 | #145 | Good 92.8% |
| Iroquois | 79.1 /100 | #146 | Good 92.8% |
| Immigrants | Kenya | 78.7 /100 | #147 | Good 92.8% |
| Hmong | 78.6 /100 | #148 | Good 92.8% |
| Immigrants | Poland | 78.5 /100 | #149 | Good 92.8% |
| Immigrants | Egypt | 77.5 /100 | #150 | Good 92.8% |
Demographics Similar to Spaniards by 11th Grade
In terms of 11th grade, the demographic groups most similar to Spaniards are Shoshone (92.5%, a difference of 0.020%), Guamanian/Chamorro (92.5%, a difference of 0.020%), Asian (92.5%, a difference of 0.030%), Sudanese (92.5%, a difference of 0.030%), and Immigrants from Pakistan (92.5%, a difference of 0.050%).
| Demographics | Rating | Rank | 11th Grade |
| Immigrants | Albania | 57.8 /100 | #169 | Average 92.6% |
| Immigrants | Northern Africa | 57.3 /100 | #170 | Average 92.6% |
| Laotians | 54.4 /100 | #171 | Average 92.6% |
| Immigrants | Pakistan | 52.3 /100 | #172 | Average 92.5% |
| Indians (Asian) | 51.5 /100 | #173 | Average 92.5% |
| Asians | 50.0 /100 | #174 | Average 92.5% |
| Shoshone | 48.9 /100 | #175 | Average 92.5% |
| Spaniards | 46.9 /100 | #176 | Average 92.5% |
| Guamanians/Chamorros | 45.0 /100 | #177 | Average 92.5% |
| Sudanese | 43.4 /100 | #178 | Average 92.5% |
| Creek | 40.9 /100 | #179 | Average 92.4% |
| Inupiat | 40.7 /100 | #180 | Average 92.4% |
| Cherokee | 40.7 /100 | #181 | Average 92.4% |
| Immigrants | Morocco | 38.6 /100 | #182 | Fair 92.4% |
| Immigrants | Malaysia | 37.6 /100 | #183 | Fair 92.4% |