New Zealander vs Spaniard 12th Grade, No Diploma
COMPARE
New Zealander
Spaniard
12th Grade, No Diploma
12th Grade, No Diploma Comparison
New Zealanders
Spaniards
92.8%
12TH GRADE, NO DIPLOMA
99.7/ 100
METRIC RATING
56th/ 347
METRIC RANK
91.0%
12TH GRADE, NO DIPLOMA
36.2/ 100
METRIC RATING
184th/ 347
METRIC RANK
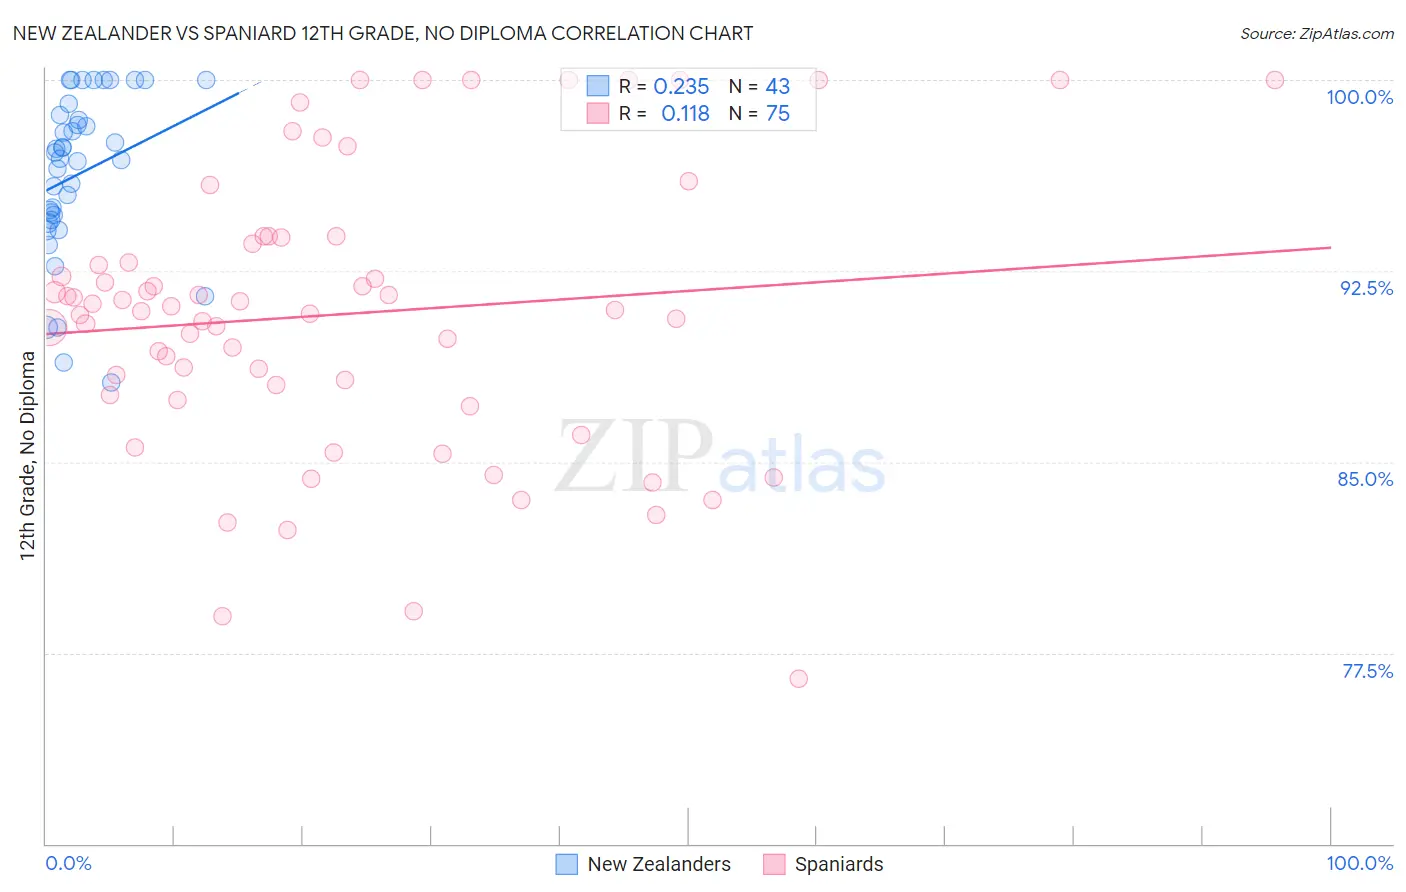
New Zealander vs Spaniard 12th Grade, No Diploma Correlation Chart
The statistical analysis conducted on geographies consisting of 106,912,053 people shows a weak positive correlation between the proportion of New Zealanders and percentage of population with at least 12th grade (no diploma) education in the United States with a correlation coefficient (R) of 0.235 and weighted average of 92.8%. Similarly, the statistical analysis conducted on geographies consisting of 443,544,054 people shows a poor positive correlation between the proportion of Spaniards and percentage of population with at least 12th grade (no diploma) education in the United States with a correlation coefficient (R) of 0.118 and weighted average of 91.0%, a difference of 2.0%.
12th Grade, No Diploma Correlation Summary
| Measurement | New Zealander | Spaniard |
| Minimum | 88.1% | 76.5% |
| Maximum | 100.0% | 100.0% |
| Range | 11.9% | 23.5% |
| Mean | 96.3% | 90.8% |
| Median | 96.9% | 91.0% |
| Interquartile 25% (IQ1) | 94.5% | 87.6% |
| Interquartile 75% (IQ3) | 98.6% | 93.8% |
| Interquartile Range (IQR) | 4.1% | 6.2% |
| Standard Deviation (Sample) | 3.2% | 5.5% |
| Standard Deviation (Population) | 3.1% | 5.5% |
Similar Demographics by 12th Grade, No Diploma
Demographics Similar to New Zealanders by 12th Grade, No Diploma
In terms of 12th grade, no diploma, the demographic groups most similar to New Zealanders are Serbian (92.8%, a difference of 0.010%), Hungarian (92.8%, a difference of 0.010%), Welsh (92.8%, a difference of 0.010%), Immigrants from Sweden (92.8%, a difference of 0.020%), and Immigrants from Canada (92.8%, a difference of 0.030%).
| Demographics | Rating | Rank | 12th Grade, No Diploma |
| Macedonians | 99.8 /100 | #49 | Exceptional 92.9% |
| Tsimshian | 99.8 /100 | #50 | Exceptional 92.9% |
| Immigrants | Belgium | 99.8 /100 | #51 | Exceptional 92.9% |
| Immigrants | Sweden | 99.8 /100 | #52 | Exceptional 92.8% |
| Serbians | 99.7 /100 | #53 | Exceptional 92.8% |
| Hungarians | 99.7 /100 | #54 | Exceptional 92.8% |
| Welsh | 99.7 /100 | #55 | Exceptional 92.8% |
| New Zealanders | 99.7 /100 | #56 | Exceptional 92.8% |
| Immigrants | Canada | 99.7 /100 | #57 | Exceptional 92.8% |
| Immigrants | Taiwan | 99.7 /100 | #58 | Exceptional 92.8% |
| Immigrants | North America | 99.7 /100 | #59 | Exceptional 92.8% |
| Slavs | 99.7 /100 | #60 | Exceptional 92.8% |
| Immigrants | Japan | 99.7 /100 | #61 | Exceptional 92.8% |
| Ukrainians | 99.6 /100 | #62 | Exceptional 92.7% |
| Zimbabweans | 99.6 /100 | #63 | Exceptional 92.7% |
Demographics Similar to Spaniards by 12th Grade, No Diploma
In terms of 12th grade, no diploma, the demographic groups most similar to Spaniards are Sudanese (91.0%, a difference of 0.020%), Nonimmigrants (91.0%, a difference of 0.030%), Osage (91.0%, a difference of 0.030%), Ethiopian (91.0%, a difference of 0.030%), and Guamanian/Chamorro (91.0%, a difference of 0.040%).
| Demographics | Rating | Rank | 12th Grade, No Diploma |
| Sierra Leoneans | 47.7 /100 | #177 | Average 91.1% |
| Spanish | 43.7 /100 | #178 | Average 91.1% |
| Immigrants | Chile | 43.3 /100 | #179 | Average 91.1% |
| Immigrants | Syria | 40.3 /100 | #180 | Average 91.1% |
| Guamanians/Chamorros | 39.5 /100 | #181 | Fair 91.0% |
| Immigrants | Nonimmigrants | 38.8 /100 | #182 | Fair 91.0% |
| Osage | 38.3 /100 | #183 | Fair 91.0% |
| Spaniards | 36.2 /100 | #184 | Fair 91.0% |
| Sudanese | 34.4 /100 | #185 | Fair 91.0% |
| Ethiopians | 33.9 /100 | #186 | Fair 91.0% |
| Potawatomi | 32.9 /100 | #187 | Fair 91.0% |
| Americans | 32.6 /100 | #188 | Fair 91.0% |
| Immigrants | Uganda | 31.6 /100 | #189 | Fair 90.9% |
| Afghans | 29.9 /100 | #190 | Fair 90.9% |
| Moroccans | 28.8 /100 | #191 | Fair 90.9% |