New Zealander vs Moroccan 4th Grade
COMPARE
New Zealander
Moroccan
4th Grade
4th Grade Comparison
New Zealanders
Moroccans
98.0%
4TH GRADE
99.6/ 100
METRIC RATING
67th/ 347
METRIC RANK
97.3%
4TH GRADE
11.3/ 100
METRIC RATING
207th/ 347
METRIC RANK
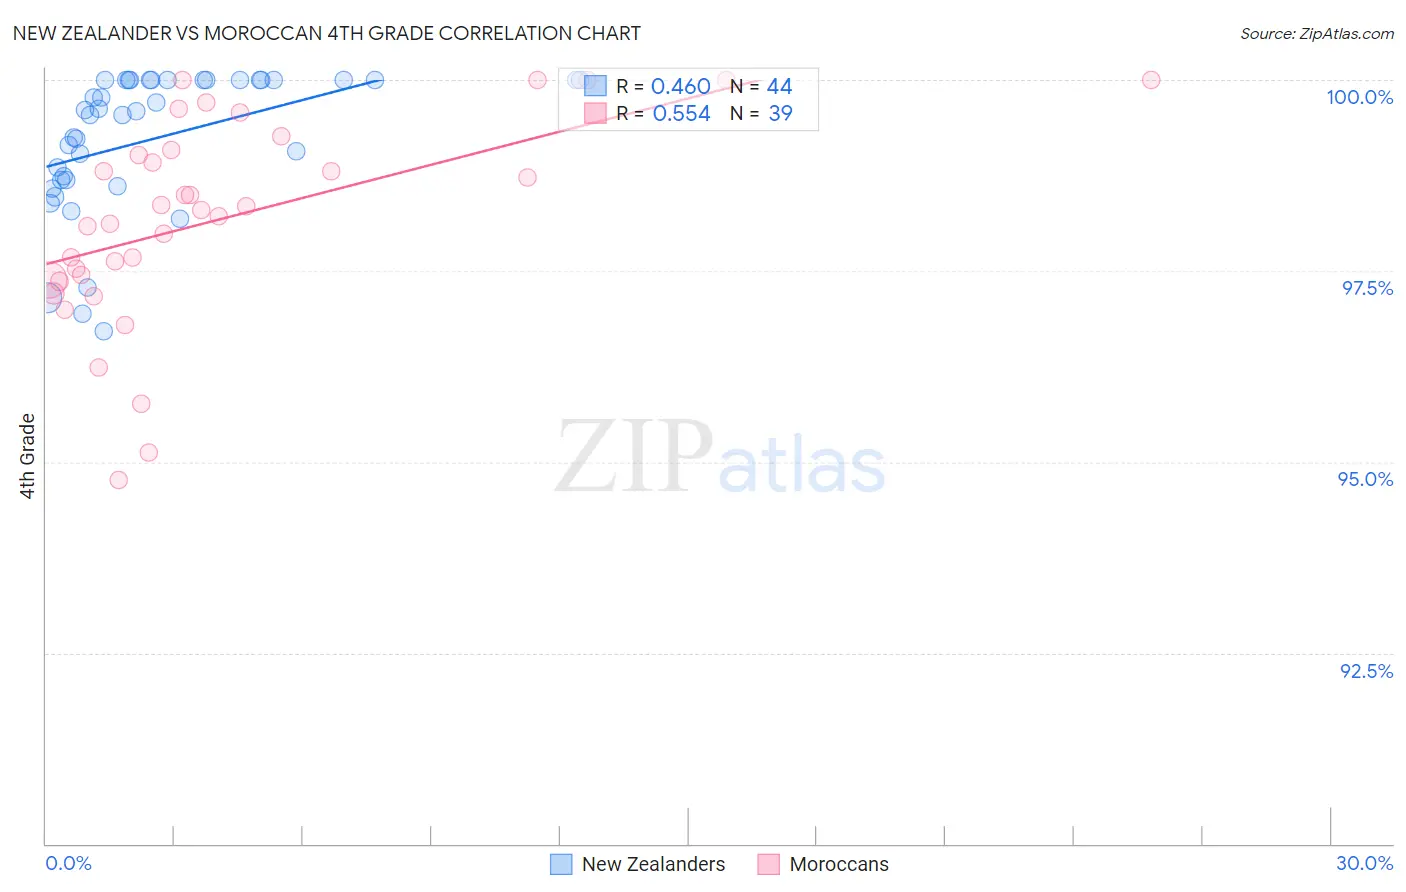
New Zealander vs Moroccan 4th Grade Correlation Chart
The statistical analysis conducted on geographies consisting of 106,912,544 people shows a moderate positive correlation between the proportion of New Zealanders and percentage of population with at least 4th grade education in the United States with a correlation coefficient (R) of 0.460 and weighted average of 98.0%. Similarly, the statistical analysis conducted on geographies consisting of 201,817,667 people shows a substantial positive correlation between the proportion of Moroccans and percentage of population with at least 4th grade education in the United States with a correlation coefficient (R) of 0.554 and weighted average of 97.3%, a difference of 0.72%.
4th Grade Correlation Summary
| Measurement | New Zealander | Moroccan |
| Minimum | 96.7% | 94.8% |
| Maximum | 100.0% | 100.0% |
| Range | 3.3% | 5.2% |
| Mean | 99.2% | 98.2% |
| Median | 99.6% | 98.3% |
| Interquartile 25% (IQ1) | 98.7% | 97.4% |
| Interquartile 75% (IQ3) | 100.0% | 99.1% |
| Interquartile Range (IQR) | 1.3% | 1.7% |
| Standard Deviation (Sample) | 0.92% | 1.3% |
| Standard Deviation (Population) | 0.91% | 1.3% |
Similar Demographics by 4th Grade
Demographics Similar to New Zealanders by 4th Grade
In terms of 4th grade, the demographic groups most similar to New Zealanders are Immigrants from Northern Europe (98.0%, a difference of 0.0%), Canadian (98.0%, a difference of 0.0%), Cajun (98.0%, a difference of 0.010%), Kiowa (98.0%, a difference of 0.010%), and Pueblo (98.0%, a difference of 0.010%).
| Demographics | Rating | Rank | 4th Grade |
| Immigrants | Canada | 99.7 /100 | #60 | Exceptional 98.1% |
| Immigrants | North America | 99.7 /100 | #61 | Exceptional 98.1% |
| Serbians | 99.7 /100 | #62 | Exceptional 98.1% |
| Russians | 99.7 /100 | #63 | Exceptional 98.0% |
| Cajuns | 99.7 /100 | #64 | Exceptional 98.0% |
| Immigrants | Northern Europe | 99.6 /100 | #65 | Exceptional 98.0% |
| Canadians | 99.6 /100 | #66 | Exceptional 98.0% |
| New Zealanders | 99.6 /100 | #67 | Exceptional 98.0% |
| Kiowa | 99.6 /100 | #68 | Exceptional 98.0% |
| Pueblo | 99.6 /100 | #69 | Exceptional 98.0% |
| Immigrants | Austria | 99.6 /100 | #70 | Exceptional 98.0% |
| Lumbee | 99.6 /100 | #71 | Exceptional 98.0% |
| Iranians | 99.4 /100 | #72 | Exceptional 98.0% |
| Macedonians | 99.4 /100 | #73 | Exceptional 98.0% |
| Chickasaw | 99.4 /100 | #74 | Exceptional 98.0% |
Demographics Similar to Moroccans by 4th Grade
In terms of 4th grade, the demographic groups most similar to Moroccans are Immigrants from Zaire (97.3%, a difference of 0.010%), Immigrants from Bahamas (97.3%, a difference of 0.010%), Paiute (97.3%, a difference of 0.020%), Laotian (97.3%, a difference of 0.020%), and Immigrants from Oceania (97.3%, a difference of 0.020%).
| Demographics | Rating | Rank | 4th Grade |
| Immigrants | Uganda | 19.8 /100 | #200 | Poor 97.4% |
| Immigrants | Southern Europe | 16.2 /100 | #201 | Poor 97.4% |
| Immigrants | Chile | 16.1 /100 | #202 | Poor 97.4% |
| Immigrants | Northern Africa | 15.1 /100 | #203 | Poor 97.4% |
| Africans | 14.6 /100 | #204 | Poor 97.4% |
| Paiute | 13.2 /100 | #205 | Poor 97.3% |
| Immigrants | Zaire | 12.8 /100 | #206 | Poor 97.3% |
| Moroccans | 11.3 /100 | #207 | Poor 97.3% |
| Immigrants | Bahamas | 10.8 /100 | #208 | Poor 97.3% |
| Laotians | 9.3 /100 | #209 | Tragic 97.3% |
| Immigrants | Oceania | 9.1 /100 | #210 | Tragic 97.3% |
| Sudanese | 9.0 /100 | #211 | Tragic 97.3% |
| Tohono O'odham | 8.4 /100 | #212 | Tragic 97.3% |
| Costa Ricans | 8.3 /100 | #213 | Tragic 97.3% |
| Immigrants | Nepal | 7.7 /100 | #214 | Tragic 97.3% |