Immigrants from Western Asia vs Immigrants from Oceania Bachelor's Degree
COMPARE
Immigrants from Western Asia
Immigrants from Oceania
Bachelor's Degree
Bachelor's Degree Comparison
Immigrants from Western Asia
Immigrants from Oceania
42.3%
BACHELOR'S DEGREE
99.2/ 100
METRIC RATING
84th/ 347
METRIC RANK
37.3%
BACHELOR'S DEGREE
37.3/ 100
METRIC RATING
188th/ 347
METRIC RANK
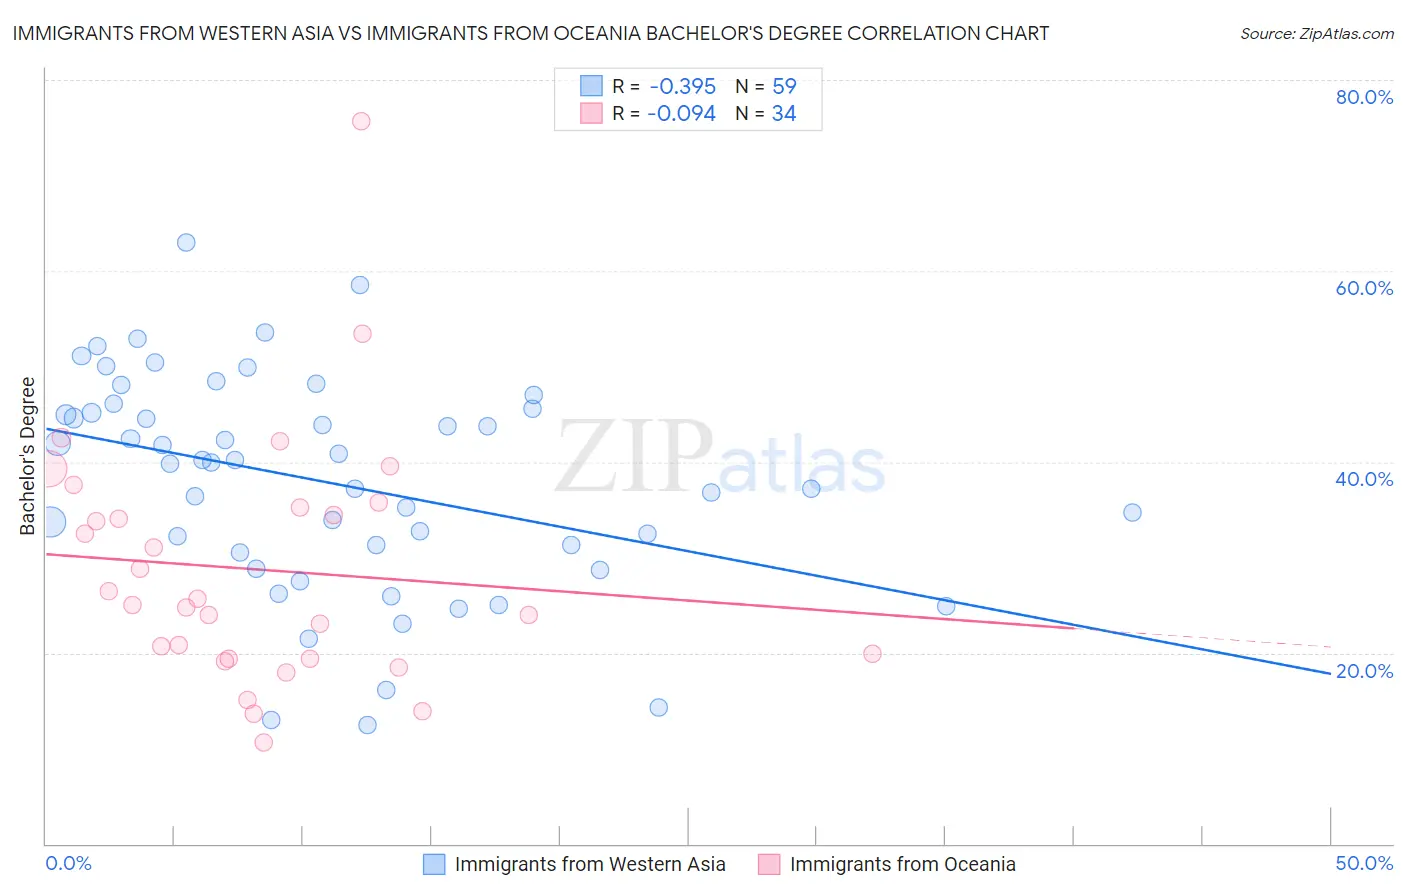
Immigrants from Western Asia vs Immigrants from Oceania Bachelor's Degree Correlation Chart
The statistical analysis conducted on geographies consisting of 404,403,411 people shows a mild negative correlation between the proportion of Immigrants from Western Asia and percentage of population with at least bachelor's degree education in the United States with a correlation coefficient (R) of -0.395 and weighted average of 42.3%. Similarly, the statistical analysis conducted on geographies consisting of 305,508,659 people shows a slight negative correlation between the proportion of Immigrants from Oceania and percentage of population with at least bachelor's degree education in the United States with a correlation coefficient (R) of -0.094 and weighted average of 37.3%, a difference of 13.2%.
Bachelor's Degree Correlation Summary
| Measurement | Immigrants from Western Asia | Immigrants from Oceania |
| Minimum | 12.5% | 10.7% |
| Maximum | 62.9% | 75.7% |
| Range | 50.4% | 65.0% |
| Mean | 37.8% | 28.7% |
| Median | 39.9% | 25.4% |
| Interquartile 25% (IQ1) | 30.5% | 19.4% |
| Interquartile 75% (IQ3) | 45.5% | 35.2% |
| Interquartile Range (IQR) | 15.0% | 15.8% |
| Standard Deviation (Sample) | 11.3% | 12.9% |
| Standard Deviation (Population) | 11.2% | 12.7% |
Similar Demographics by Bachelor's Degree
Demographics Similar to Immigrants from Western Asia by Bachelor's Degree
In terms of bachelor's degree, the demographic groups most similar to Immigrants from Western Asia are Armenian (42.3%, a difference of 0.020%), Lithuanian (42.2%, a difference of 0.030%), Immigrants from Scotland (42.3%, a difference of 0.050%), Immigrants from Hungary (42.3%, a difference of 0.11%), and Immigrants from Brazil (42.2%, a difference of 0.11%).
| Demographics | Rating | Rank | Bachelor's Degree |
| Immigrants | Eastern Europe | 99.4 /100 | #77 | Exceptional 42.5% |
| Immigrants | Ethiopia | 99.4 /100 | #78 | Exceptional 42.5% |
| Immigrants | Lebanon | 99.3 /100 | #79 | Exceptional 42.4% |
| Immigrants | Croatia | 99.2 /100 | #80 | Exceptional 42.3% |
| Immigrants | Hungary | 99.2 /100 | #81 | Exceptional 42.3% |
| Immigrants | Scotland | 99.2 /100 | #82 | Exceptional 42.3% |
| Armenians | 99.2 /100 | #83 | Exceptional 42.3% |
| Immigrants | Western Asia | 99.2 /100 | #84 | Exceptional 42.3% |
| Lithuanians | 99.2 /100 | #85 | Exceptional 42.2% |
| Immigrants | Brazil | 99.2 /100 | #86 | Exceptional 42.2% |
| Carpatho Rusyns | 99.0 /100 | #87 | Exceptional 42.1% |
| Immigrants | Western Europe | 99.0 /100 | #88 | Exceptional 42.0% |
| Greeks | 99.0 /100 | #89 | Exceptional 42.0% |
| Laotians | 98.9 /100 | #90 | Exceptional 42.0% |
| Immigrants | Northern Africa | 98.9 /100 | #91 | Exceptional 41.9% |
Demographics Similar to Immigrants from Oceania by Bachelor's Degree
In terms of bachelor's degree, the demographic groups most similar to Immigrants from Oceania are Slovak (37.3%, a difference of 0.050%), English (37.4%, a difference of 0.24%), Norwegian (37.5%, a difference of 0.32%), Swiss (37.2%, a difference of 0.35%), and Nigerian (37.2%, a difference of 0.37%).
| Demographics | Rating | Rank | Bachelor's Degree |
| Immigrants | Senegal | 43.8 /100 | #181 | Average 37.6% |
| Immigrants | Bosnia and Herzegovina | 43.4 /100 | #182 | Average 37.6% |
| Senegalese | 42.2 /100 | #183 | Average 37.5% |
| Scandinavians | 41.7 /100 | #184 | Average 37.5% |
| Immigrants | Peru | 41.3 /100 | #185 | Average 37.5% |
| Norwegians | 40.4 /100 | #186 | Average 37.5% |
| English | 39.7 /100 | #187 | Fair 37.4% |
| Immigrants | Oceania | 37.3 /100 | #188 | Fair 37.3% |
| Slovaks | 36.9 /100 | #189 | Fair 37.3% |
| Swiss | 34.1 /100 | #190 | Fair 37.2% |
| Nigerians | 33.9 /100 | #191 | Fair 37.2% |
| Immigrants | Vietnam | 32.1 /100 | #192 | Fair 37.1% |
| Yugoslavians | 31.5 /100 | #193 | Fair 37.1% |
| Belgians | 29.9 /100 | #194 | Fair 37.0% |
| Koreans | 29.8 /100 | #195 | Fair 37.0% |