Immigrants from Pakistan vs Cree 11th Grade
COMPARE
Immigrants from Pakistan
Cree
11th Grade
11th Grade Comparison
Immigrants from Pakistan
Cree
92.5%
11TH GRADE
52.3/ 100
METRIC RATING
172nd/ 347
METRIC RANK
92.9%
11TH GRADE
85.9/ 100
METRIC RATING
136th/ 347
METRIC RANK
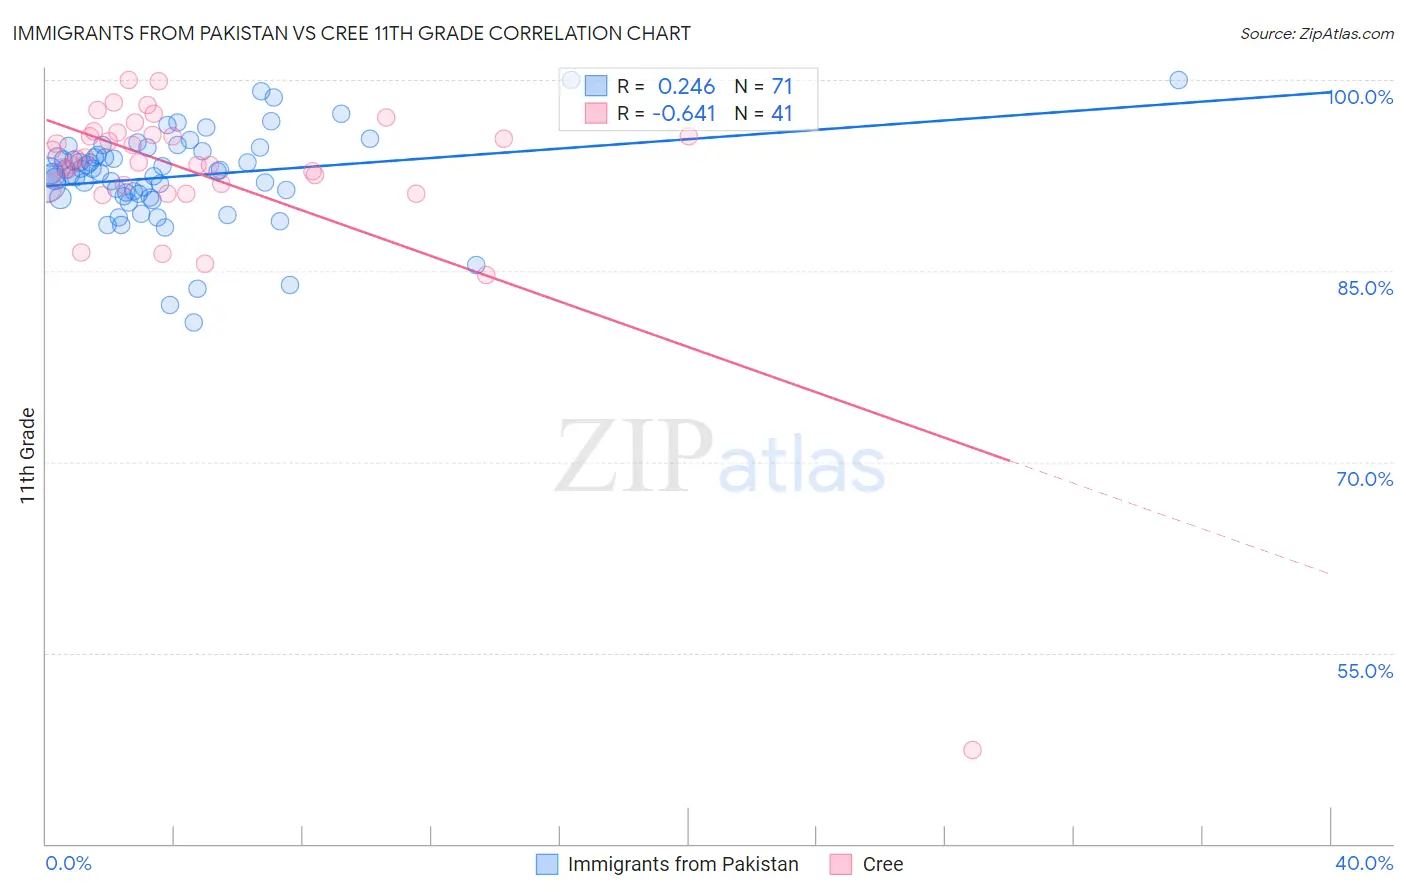
Immigrants from Pakistan vs Cree 11th Grade Correlation Chart
The statistical analysis conducted on geographies consisting of 283,836,095 people shows a weak positive correlation between the proportion of Immigrants from Pakistan and percentage of population with at least 11th grade education in the United States with a correlation coefficient (R) of 0.246 and weighted average of 92.5%. Similarly, the statistical analysis conducted on geographies consisting of 76,211,744 people shows a significant negative correlation between the proportion of Cree and percentage of population with at least 11th grade education in the United States with a correlation coefficient (R) of -0.641 and weighted average of 92.9%, a difference of 0.42%.
11th Grade Correlation Summary
| Measurement | Immigrants from Pakistan | Cree |
| Minimum | 81.0% | 47.4% |
| Maximum | 100.0% | 100.0% |
| Range | 19.0% | 52.6% |
| Mean | 92.4% | 92.6% |
| Median | 92.8% | 93.8% |
| Interquartile 25% (IQ1) | 90.9% | 91.6% |
| Interquartile 75% (IQ3) | 94.4% | 95.8% |
| Interquartile Range (IQR) | 3.5% | 4.2% |
| Standard Deviation (Sample) | 3.6% | 8.1% |
| Standard Deviation (Population) | 3.6% | 8.0% |
Similar Demographics by 11th Grade
Demographics Similar to Immigrants from Pakistan by 11th Grade
In terms of 11th grade, the demographic groups most similar to Immigrants from Pakistan are Indian (Asian) (92.5%, a difference of 0.010%), Laotian (92.6%, a difference of 0.020%), Asian (92.5%, a difference of 0.020%), Shoshone (92.5%, a difference of 0.030%), and Immigrants from Albania (92.6%, a difference of 0.050%).
| Demographics | Rating | Rank | 11th Grade |
| Immigrants | Iraq | 63.7 /100 | #165 | Good 92.6% |
| Bermudans | 62.3 /100 | #166 | Good 92.6% |
| Alsatians | 60.2 /100 | #167 | Good 92.6% |
| Sierra Leoneans | 58.7 /100 | #168 | Average 92.6% |
| Immigrants | Albania | 57.8 /100 | #169 | Average 92.6% |
| Immigrants | Northern Africa | 57.3 /100 | #170 | Average 92.6% |
| Laotians | 54.4 /100 | #171 | Average 92.6% |
| Immigrants | Pakistan | 52.3 /100 | #172 | Average 92.5% |
| Indians (Asian) | 51.5 /100 | #173 | Average 92.5% |
| Asians | 50.0 /100 | #174 | Average 92.5% |
| Shoshone | 48.9 /100 | #175 | Average 92.5% |
| Spaniards | 46.9 /100 | #176 | Average 92.5% |
| Guamanians/Chamorros | 45.0 /100 | #177 | Average 92.5% |
| Sudanese | 43.4 /100 | #178 | Average 92.5% |
| Creek | 40.9 /100 | #179 | Average 92.4% |
Demographics Similar to Cree by 11th Grade
In terms of 11th grade, the demographic groups most similar to Cree are Immigrants from Italy (92.9%, a difference of 0.010%), Arab (92.9%, a difference of 0.010%), Immigrants from Brazil (92.9%, a difference of 0.020%), Mongolian (93.0%, a difference of 0.030%), and Delaware (93.0%, a difference of 0.030%).
| Demographics | Rating | Rank | 11th Grade |
| Immigrants | Ukraine | 89.8 /100 | #129 | Excellent 93.0% |
| Albanians | 89.5 /100 | #130 | Excellent 93.0% |
| Egyptians | 89.5 /100 | #131 | Excellent 93.0% |
| Immigrants | Bosnia and Herzegovina | 89.0 /100 | #132 | Excellent 93.0% |
| Mongolians | 87.6 /100 | #133 | Excellent 93.0% |
| Delaware | 87.3 /100 | #134 | Excellent 93.0% |
| Immigrants | Italy | 86.6 /100 | #135 | Excellent 92.9% |
| Cree | 85.9 /100 | #136 | Excellent 92.9% |
| Arabs | 85.4 /100 | #137 | Excellent 92.9% |
| Immigrants | Brazil | 85.1 /100 | #138 | Excellent 92.9% |
| Crow | 84.1 /100 | #139 | Excellent 92.9% |
| Venezuelans | 83.4 /100 | #140 | Excellent 92.9% |
| Chileans | 83.0 /100 | #141 | Excellent 92.9% |
| Kenyans | 82.0 /100 | #142 | Excellent 92.9% |
| Ugandans | 81.4 /100 | #143 | Excellent 92.9% |