Bhutanese vs Yaqui 9th Grade
COMPARE
Bhutanese
Yaqui
9th Grade
9th Grade Comparison
Bhutanese
Yaqui
95.7%
9TH GRADE
99.3/ 100
METRIC RATING
80th/ 347
METRIC RANK
92.9%
9TH GRADE
0.0/ 100
METRIC RATING
300th/ 347
METRIC RANK
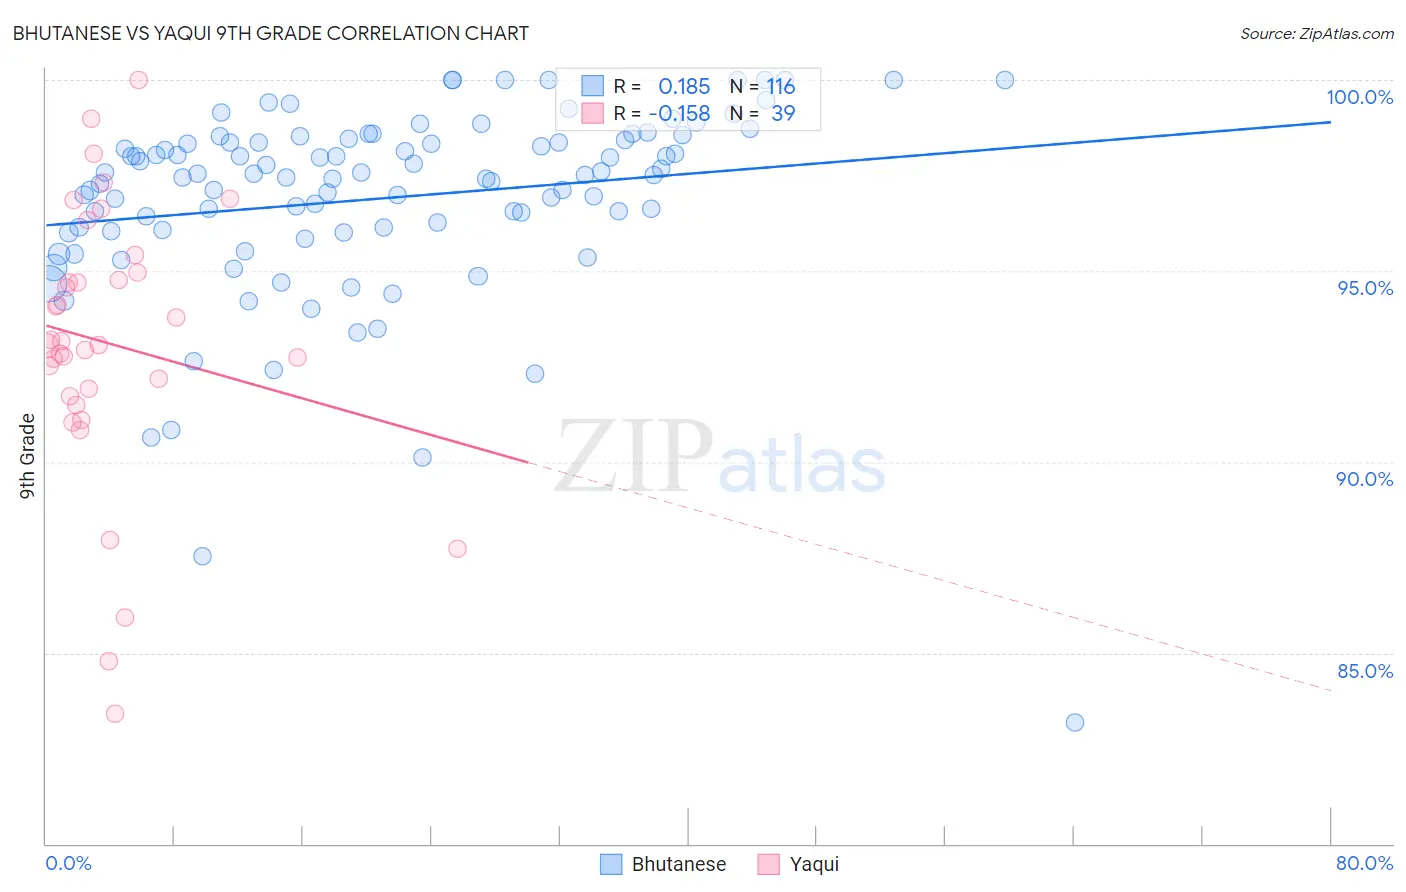
Bhutanese vs Yaqui 9th Grade Correlation Chart
The statistical analysis conducted on geographies consisting of 455,591,134 people shows a poor positive correlation between the proportion of Bhutanese and percentage of population with at least 9th grade education in the United States with a correlation coefficient (R) of 0.185 and weighted average of 95.7%. Similarly, the statistical analysis conducted on geographies consisting of 107,725,021 people shows a poor negative correlation between the proportion of Yaqui and percentage of population with at least 9th grade education in the United States with a correlation coefficient (R) of -0.158 and weighted average of 92.9%, a difference of 3.0%.
9th Grade Correlation Summary
| Measurement | Bhutanese | Yaqui |
| Minimum | 83.2% | 83.4% |
| Maximum | 100.0% | 100.0% |
| Range | 16.8% | 16.6% |
| Mean | 96.9% | 93.1% |
| Median | 97.5% | 93.1% |
| Interquartile 25% (IQ1) | 96.1% | 91.7% |
| Interquartile 75% (IQ3) | 98.4% | 94.9% |
| Interquartile Range (IQR) | 2.3% | 3.2% |
| Standard Deviation (Sample) | 2.6% | 3.6% |
| Standard Deviation (Population) | 2.6% | 3.5% |
Similar Demographics by 9th Grade
Demographics Similar to Bhutanese by 9th Grade
In terms of 9th grade, the demographic groups most similar to Bhutanese are Arapaho (95.7%, a difference of 0.0%), Puget Sound Salish (95.7%, a difference of 0.0%), Romanian (95.7%, a difference of 0.020%), Swiss (95.7%, a difference of 0.020%), and Immigrants from Denmark (95.7%, a difference of 0.030%).
| Demographics | Rating | Rank | 9th Grade |
| Immigrants | Singapore | 99.5 /100 | #73 | Exceptional 95.8% |
| Thais | 99.5 /100 | #74 | Exceptional 95.8% |
| Inupiat | 99.5 /100 | #75 | Exceptional 95.8% |
| Immigrants | Sweden | 99.5 /100 | #76 | Exceptional 95.8% |
| Whites/Caucasians | 99.4 /100 | #77 | Exceptional 95.8% |
| Immigrants | South Africa | 99.4 /100 | #78 | Exceptional 95.8% |
| Romanians | 99.3 /100 | #79 | Exceptional 95.7% |
| Bhutanese | 99.3 /100 | #80 | Exceptional 95.7% |
| Arapaho | 99.3 /100 | #81 | Exceptional 95.7% |
| Puget Sound Salish | 99.2 /100 | #82 | Exceptional 95.7% |
| Swiss | 99.2 /100 | #83 | Exceptional 95.7% |
| Immigrants | Denmark | 99.1 /100 | #84 | Exceptional 95.7% |
| Icelanders | 99.1 /100 | #85 | Exceptional 95.7% |
| Immigrants | Western Europe | 99.1 /100 | #86 | Exceptional 95.7% |
| Okinawans | 99.0 /100 | #87 | Exceptional 95.7% |
Demographics Similar to Yaqui by 9th Grade
In terms of 9th grade, the demographic groups most similar to Yaqui are Immigrants from Grenada (93.0%, a difference of 0.13%), Immigrants from Haiti (92.7%, a difference of 0.17%), Haitian (93.1%, a difference of 0.20%), Fijian (93.1%, a difference of 0.22%), and Immigrants from Dominica (92.7%, a difference of 0.25%).
| Demographics | Rating | Rank | 9th Grade |
| Sri Lankans | 0.0 /100 | #293 | Tragic 93.2% |
| Cubans | 0.0 /100 | #294 | Tragic 93.2% |
| Immigrants | Burma/Myanmar | 0.0 /100 | #295 | Tragic 93.1% |
| Indonesians | 0.0 /100 | #296 | Tragic 93.1% |
| Fijians | 0.0 /100 | #297 | Tragic 93.1% |
| Haitians | 0.0 /100 | #298 | Tragic 93.1% |
| Immigrants | Grenada | 0.0 /100 | #299 | Tragic 93.0% |
| Yaqui | 0.0 /100 | #300 | Tragic 92.9% |
| Immigrants | Haiti | 0.0 /100 | #301 | Tragic 92.7% |
| Immigrants | Dominica | 0.0 /100 | #302 | Tragic 92.7% |
| Guyanese | 0.0 /100 | #303 | Tragic 92.7% |
| Tohono O'odham | 0.0 /100 | #304 | Tragic 92.6% |
| Japanese | 0.0 /100 | #305 | Tragic 92.6% |
| Immigrants | Vietnam | 0.0 /100 | #306 | Tragic 92.6% |
| Immigrants | Immigrants | 0.0 /100 | #307 | Tragic 92.5% |