Native/Alaskan vs Shoshone 5th Grade
COMPARE
Native/Alaskan
Shoshone
5th Grade
5th Grade Comparison
Natives/Alaskans
Shoshone
97.2%
5TH GRADE
18.0/ 100
METRIC RATING
199th/ 347
METRIC RANK
97.8%
5TH GRADE
98.8/ 100
METRIC RATING
88th/ 347
METRIC RANK
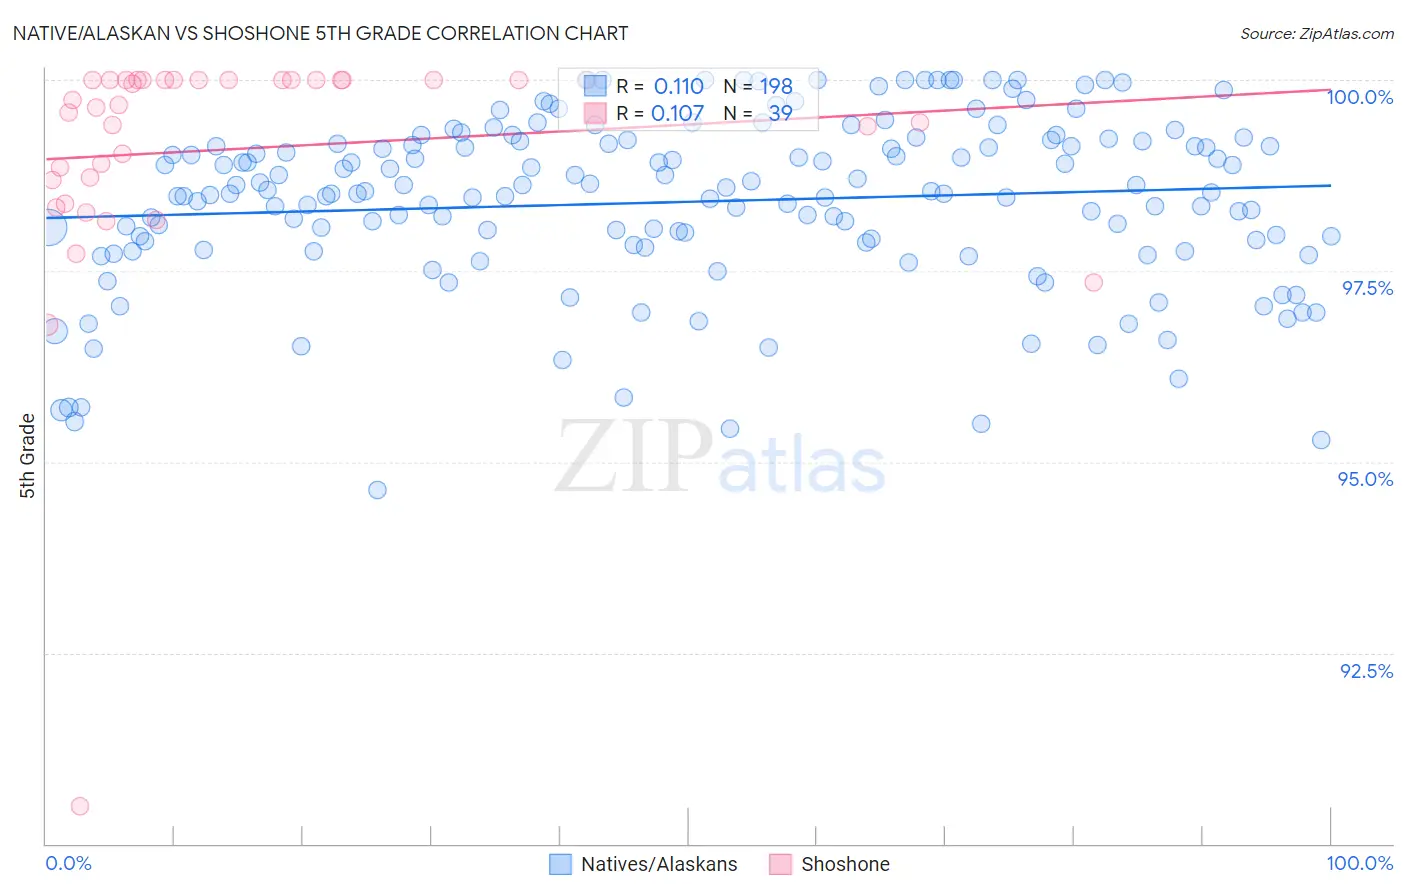
Native/Alaskan vs Shoshone 5th Grade Correlation Chart
The statistical analysis conducted on geographies consisting of 513,072,444 people shows a poor positive correlation between the proportion of Natives/Alaskans and percentage of population with at least 5th grade education in the United States with a correlation coefficient (R) of 0.110 and weighted average of 97.2%. Similarly, the statistical analysis conducted on geographies consisting of 66,625,086 people shows a poor positive correlation between the proportion of Shoshone and percentage of population with at least 5th grade education in the United States with a correlation coefficient (R) of 0.107 and weighted average of 97.8%, a difference of 0.62%.
5th Grade Correlation Summary
| Measurement | Native/Alaskan | Shoshone |
| Minimum | 94.6% | 90.5% |
| Maximum | 100.0% | 100.0% |
| Range | 5.4% | 9.5% |
| Mean | 98.4% | 99.1% |
| Median | 98.5% | 99.7% |
| Interquartile 25% (IQ1) | 97.8% | 98.7% |
| Interquartile 75% (IQ3) | 99.2% | 100.0% |
| Interquartile Range (IQR) | 1.3% | 1.3% |
| Standard Deviation (Sample) | 1.1% | 1.7% |
| Standard Deviation (Population) | 1.1% | 1.6% |
Similar Demographics by 5th Grade
Demographics Similar to Natives/Alaskans by 5th Grade
In terms of 5th grade, the demographic groups most similar to Natives/Alaskans are Immigrants from Northern Africa (97.2%, a difference of 0.010%), Immigrants from Chile (97.2%, a difference of 0.010%), Immigrants from Uganda (97.2%, a difference of 0.020%), African (97.2%, a difference of 0.020%), and Immigrants from Bahamas (97.2%, a difference of 0.020%).
| Demographics | Rating | Rank | 5th Grade |
| Panamanians | 31.3 /100 | #192 | Fair 97.3% |
| Navajo | 29.0 /100 | #193 | Fair 97.2% |
| Immigrants | Albania | 28.5 /100 | #194 | Fair 97.2% |
| Guamanians/Chamorros | 26.8 /100 | #195 | Fair 97.2% |
| Hawaiians | 25.6 /100 | #196 | Fair 97.2% |
| Brazilians | 25.4 /100 | #197 | Fair 97.2% |
| Immigrants | Uganda | 21.1 /100 | #198 | Fair 97.2% |
| Natives/Alaskans | 18.0 /100 | #199 | Poor 97.2% |
| Immigrants | Northern Africa | 16.8 /100 | #200 | Poor 97.2% |
| Immigrants | Chile | 16.6 /100 | #201 | Poor 97.2% |
| Africans | 15.3 /100 | #202 | Poor 97.2% |
| Immigrants | Bahamas | 14.9 /100 | #203 | Poor 97.2% |
| Immigrants | Zaire | 13.7 /100 | #204 | Poor 97.1% |
| Moroccans | 12.0 /100 | #205 | Poor 97.1% |
| Paiute | 11.6 /100 | #206 | Poor 97.1% |
Demographics Similar to Shoshone by 5th Grade
In terms of 5th grade, the demographic groups most similar to Shoshone are Immigrants from Australia (97.8%, a difference of 0.0%), Immigrants from South Africa (97.8%, a difference of 0.0%), Immigrants from Ireland (97.8%, a difference of 0.0%), Cypriot (97.8%, a difference of 0.010%), and Immigrants from Western Europe (97.8%, a difference of 0.010%).
| Demographics | Rating | Rank | 5th Grade |
| Icelanders | 99.2 /100 | #81 | Exceptional 97.8% |
| Pueblo | 99.2 /100 | #82 | Exceptional 97.8% |
| Zimbabweans | 99.0 /100 | #83 | Exceptional 97.8% |
| Potawatomi | 99.0 /100 | #84 | Exceptional 97.8% |
| Immigrants | Belgium | 99.0 /100 | #85 | Exceptional 97.8% |
| Cypriots | 98.9 /100 | #86 | Exceptional 97.8% |
| Immigrants | Australia | 98.8 /100 | #87 | Exceptional 97.8% |
| Shoshone | 98.8 /100 | #88 | Exceptional 97.8% |
| Immigrants | South Africa | 98.8 /100 | #89 | Exceptional 97.8% |
| Immigrants | Ireland | 98.8 /100 | #90 | Exceptional 97.8% |
| Immigrants | Western Europe | 98.8 /100 | #91 | Exceptional 97.8% |
| Immigrants | Sweden | 98.7 /100 | #92 | Exceptional 97.8% |
| Delaware | 98.6 /100 | #93 | Exceptional 97.8% |
| Immigrants | Denmark | 98.6 /100 | #94 | Exceptional 97.8% |
| Romanians | 98.6 /100 | #95 | Exceptional 97.8% |