Mongolian vs Immigrants from Portugal Nursery School
COMPARE
Mongolian
Immigrants from Portugal
Nursery School
Nursery School Comparison
Mongolians
Immigrants from Portugal
97.9%
NURSERY SCHOOL
27.3/ 100
METRIC RATING
194th/ 347
METRIC RANK
97.4%
NURSERY SCHOOL
0.0/ 100
METRIC RATING
286th/ 347
METRIC RANK
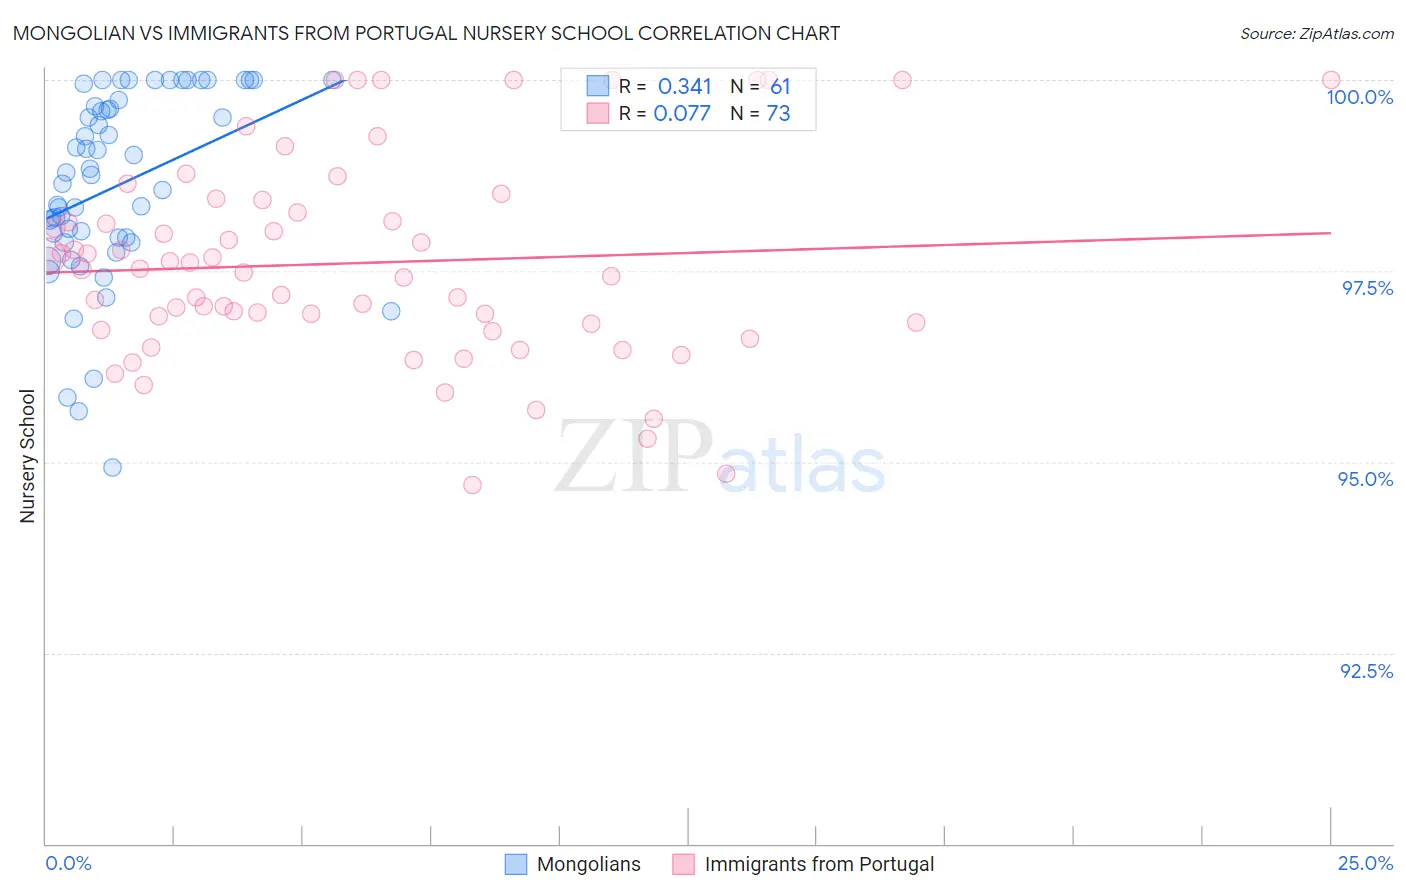
Mongolian vs Immigrants from Portugal Nursery School Correlation Chart
The statistical analysis conducted on geographies consisting of 140,362,004 people shows a mild positive correlation between the proportion of Mongolians and percentage of population with at least nursery school education in the United States with a correlation coefficient (R) of 0.341 and weighted average of 97.9%. Similarly, the statistical analysis conducted on geographies consisting of 174,792,107 people shows a slight positive correlation between the proportion of Immigrants from Portugal and percentage of population with at least nursery school education in the United States with a correlation coefficient (R) of 0.077 and weighted average of 97.4%, a difference of 0.56%.
Nursery School Correlation Summary
| Measurement | Mongolian | Immigrants from Portugal |
| Minimum | 94.9% | 94.7% |
| Maximum | 100.0% | 100.0% |
| Range | 5.1% | 5.3% |
| Mean | 98.6% | 97.6% |
| Median | 98.8% | 97.5% |
| Interquartile 25% (IQ1) | 97.9% | 96.8% |
| Interquartile 75% (IQ3) | 99.7% | 98.3% |
| Interquartile Range (IQR) | 1.8% | 1.6% |
| Standard Deviation (Sample) | 1.2% | 1.3% |
| Standard Deviation (Population) | 1.2% | 1.3% |
Similar Demographics by Nursery School
Demographics Similar to Mongolians by Nursery School
In terms of nursery school, the demographic groups most similar to Mongolians are Paraguayan (97.9%, a difference of 0.0%), Hawaiian (97.9%, a difference of 0.0%), Immigrants from Taiwan (97.9%, a difference of 0.010%), Black/African American (97.9%, a difference of 0.010%), and Guamanian/Chamorro (97.9%, a difference of 0.010%).
| Demographics | Rating | Rank | Nursery School |
| Immigrants | Kazakhstan | 37.1 /100 | #187 | Fair 97.9% |
| Arabs | 34.7 /100 | #188 | Fair 97.9% |
| Pakistanis | 34.6 /100 | #189 | Fair 97.9% |
| Panamanians | 34.3 /100 | #190 | Fair 97.9% |
| Immigrants | Taiwan | 30.6 /100 | #191 | Fair 97.9% |
| Blacks/African Americans | 29.4 /100 | #192 | Fair 97.9% |
| Paraguayans | 27.4 /100 | #193 | Fair 97.9% |
| Mongolians | 27.3 /100 | #194 | Fair 97.9% |
| Hawaiians | 27.2 /100 | #195 | Fair 97.9% |
| Guamanians/Chamorros | 25.7 /100 | #196 | Fair 97.9% |
| Yuman | 25.7 /100 | #197 | Fair 97.9% |
| Immigrants | Kenya | 24.1 /100 | #198 | Fair 97.9% |
| Immigrants | Egypt | 22.5 /100 | #199 | Fair 97.9% |
| Tohono O'odham | 22.2 /100 | #200 | Fair 97.9% |
| Immigrants | Lebanon | 21.2 /100 | #201 | Fair 97.9% |
Demographics Similar to Immigrants from Portugal by Nursery School
In terms of nursery school, the demographic groups most similar to Immigrants from Portugal are Immigrants from Barbados (97.4%, a difference of 0.0%), Immigrants from Hong Kong (97.4%, a difference of 0.010%), Immigrants from West Indies (97.4%, a difference of 0.020%), Immigrants from Trinidad and Tobago (97.4%, a difference of 0.020%), and Immigrants from Thailand (97.3%, a difference of 0.020%).
| Demographics | Rating | Rank | Nursery School |
| Immigrants | Ghana | 0.1 /100 | #279 | Tragic 97.4% |
| Barbadians | 0.0 /100 | #280 | Tragic 97.4% |
| Trinidadians and Tobagonians | 0.0 /100 | #281 | Tragic 97.4% |
| Afghans | 0.0 /100 | #282 | Tragic 97.4% |
| Immigrants | West Indies | 0.0 /100 | #283 | Tragic 97.4% |
| Immigrants | Trinidad and Tobago | 0.0 /100 | #284 | Tragic 97.4% |
| Immigrants | Barbados | 0.0 /100 | #285 | Tragic 97.4% |
| Immigrants | Portugal | 0.0 /100 | #286 | Tragic 97.4% |
| Immigrants | Hong Kong | 0.0 /100 | #287 | Tragic 97.4% |
| Immigrants | Thailand | 0.0 /100 | #288 | Tragic 97.3% |
| Immigrants | St. Vincent and the Grenadines | 0.0 /100 | #289 | Tragic 97.3% |
| Immigrants | Afghanistan | 0.0 /100 | #290 | Tragic 97.3% |
| British West Indians | 0.0 /100 | #291 | Tragic 97.3% |
| Houma | 0.0 /100 | #292 | Tragic 97.3% |
| Malaysians | 0.0 /100 | #293 | Tragic 97.3% |