Slovene vs Liberian 9th Grade
COMPARE
Slovene
Liberian
9th Grade
9th Grade Comparison
Slovenes
Liberians
96.7%
9TH GRADE
100.0/ 100
METRIC RATING
4th/ 347
METRIC RANK
94.8%
9TH GRADE
37.4/ 100
METRIC RATING
185th/ 347
METRIC RANK
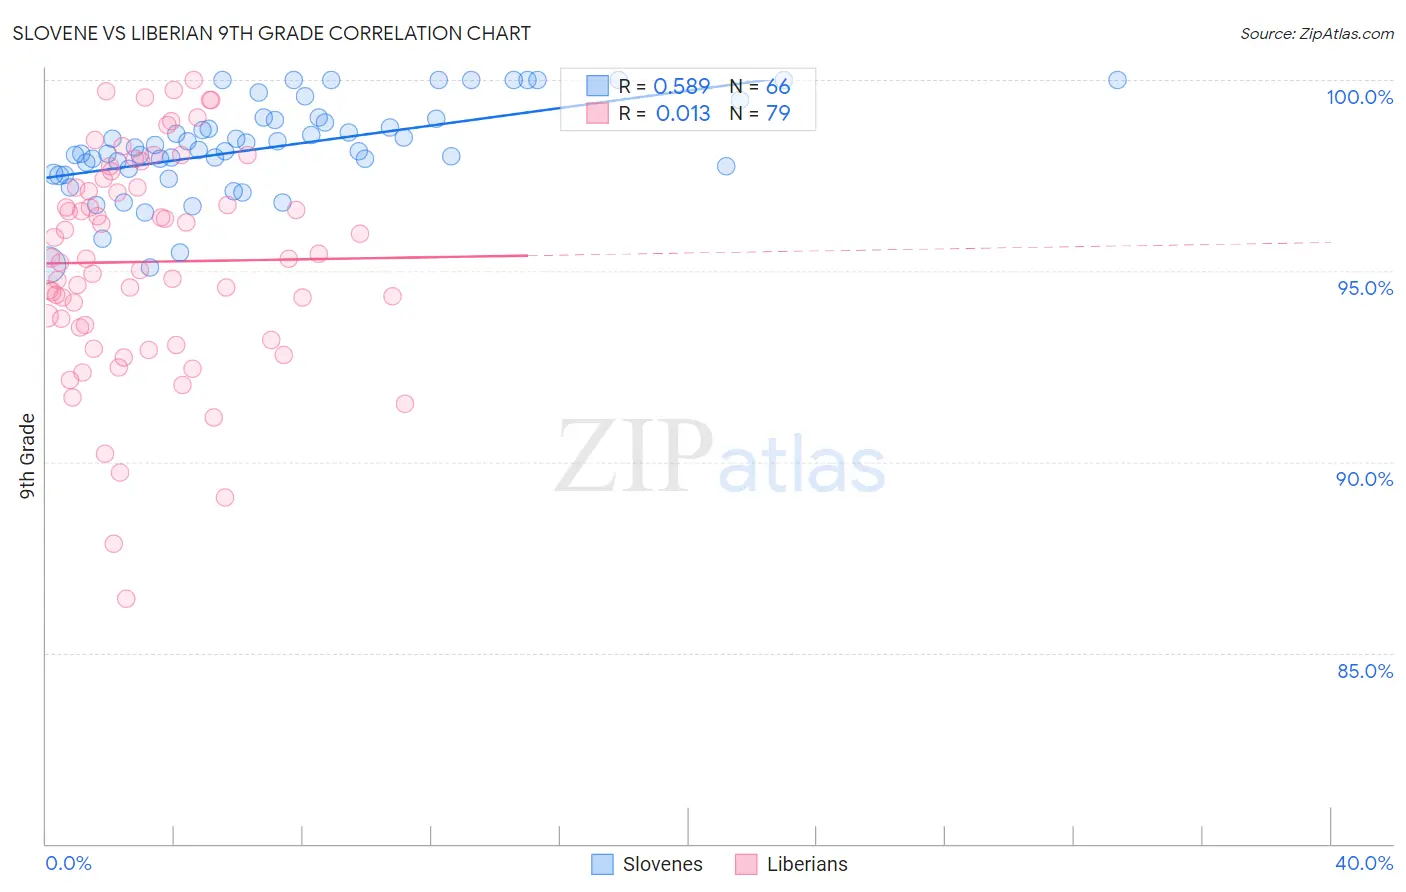
Slovene vs Liberian 9th Grade Correlation Chart
The statistical analysis conducted on geographies consisting of 261,353,374 people shows a substantial positive correlation between the proportion of Slovenes and percentage of population with at least 9th grade education in the United States with a correlation coefficient (R) of 0.589 and weighted average of 96.7%. Similarly, the statistical analysis conducted on geographies consisting of 118,101,800 people shows no correlation between the proportion of Liberians and percentage of population with at least 9th grade education in the United States with a correlation coefficient (R) of 0.013 and weighted average of 94.8%, a difference of 2.1%.
9th Grade Correlation Summary
| Measurement | Slovene | Liberian |
| Minimum | 95.1% | 86.4% |
| Maximum | 100.0% | 100.0% |
| Range | 4.9% | 13.6% |
| Mean | 98.2% | 95.2% |
| Median | 98.2% | 95.3% |
| Interquartile 25% (IQ1) | 97.7% | 93.5% |
| Interquartile 75% (IQ3) | 99.0% | 97.2% |
| Interquartile Range (IQR) | 1.3% | 3.7% |
| Standard Deviation (Sample) | 1.2% | 2.8% |
| Standard Deviation (Population) | 1.2% | 2.8% |
Similar Demographics by 9th Grade
Demographics Similar to Slovenes by 9th Grade
In terms of 9th grade, the demographic groups most similar to Slovenes are Swedish (96.7%, a difference of 0.010%), Polish (96.7%, a difference of 0.020%), Carpatho Rusyn (96.7%, a difference of 0.020%), German (96.7%, a difference of 0.030%), and Tlingit-Haida (96.6%, a difference of 0.12%).
| Demographics | Rating | Rank | 9th Grade |
| Tsimshian | 100.0 /100 | #1 | Exceptional 97.0% |
| Norwegians | 100.0 /100 | #2 | Exceptional 96.9% |
| Slovaks | 100.0 /100 | #3 | Exceptional 96.9% |
| Slovenes | 100.0 /100 | #4 | Exceptional 96.7% |
| Swedes | 100.0 /100 | #5 | Exceptional 96.7% |
| Poles | 100.0 /100 | #6 | Exceptional 96.7% |
| Carpatho Rusyns | 100.0 /100 | #7 | Exceptional 96.7% |
| Germans | 100.0 /100 | #8 | Exceptional 96.7% |
| Tlingit-Haida | 100.0 /100 | #9 | Exceptional 96.6% |
| Lithuanians | 100.0 /100 | #10 | Exceptional 96.6% |
| Finns | 100.0 /100 | #11 | Exceptional 96.6% |
| English | 100.0 /100 | #12 | Exceptional 96.6% |
| Danes | 100.0 /100 | #13 | Exceptional 96.5% |
| Scottish | 100.0 /100 | #14 | Exceptional 96.5% |
| Irish | 100.0 /100 | #15 | Exceptional 96.5% |
Demographics Similar to Liberians by 9th Grade
In terms of 9th grade, the demographic groups most similar to Liberians are Argentinean (94.8%, a difference of 0.0%), Hopi (94.8%, a difference of 0.0%), Immigrants from Nepal (94.8%, a difference of 0.020%), Guamanian/Chamorro (94.8%, a difference of 0.020%), and Immigrants from Albania (94.8%, a difference of 0.020%).
| Demographics | Rating | Rank | 9th Grade |
| Immigrants | Poland | 46.7 /100 | #178 | Average 94.9% |
| Immigrants | Venezuela | 46.5 /100 | #179 | Average 94.9% |
| Immigrants | Uganda | 43.1 /100 | #180 | Average 94.8% |
| Sierra Leoneans | 42.7 /100 | #181 | Average 94.8% |
| Seminole | 42.5 /100 | #182 | Average 94.8% |
| Immigrants | Nepal | 39.7 /100 | #183 | Fair 94.8% |
| Argentineans | 37.6 /100 | #184 | Fair 94.8% |
| Liberians | 37.4 /100 | #185 | Fair 94.8% |
| Hopi | 37.1 /100 | #186 | Fair 94.8% |
| Guamanians/Chamorros | 35.5 /100 | #187 | Fair 94.8% |
| Immigrants | Albania | 34.5 /100 | #188 | Fair 94.8% |
| Immigrants | Argentina | 34.4 /100 | #189 | Fair 94.8% |
| Sudanese | 32.7 /100 | #190 | Fair 94.7% |
| Assyrians/Chaldeans/Syriacs | 32.0 /100 | #191 | Fair 94.7% |
| Immigrants | Northern Africa | 30.7 /100 | #192 | Fair 94.7% |