Sioux vs Jamaican 4th Grade
COMPARE
Sioux
Jamaican
4th Grade
4th Grade Comparison
Sioux
Jamaicans
98.3%
4TH GRADE
100.0/ 100
METRIC RATING
23rd/ 347
METRIC RANK
97.1%
4TH GRADE
0.8/ 100
METRIC RATING
252nd/ 347
METRIC RANK
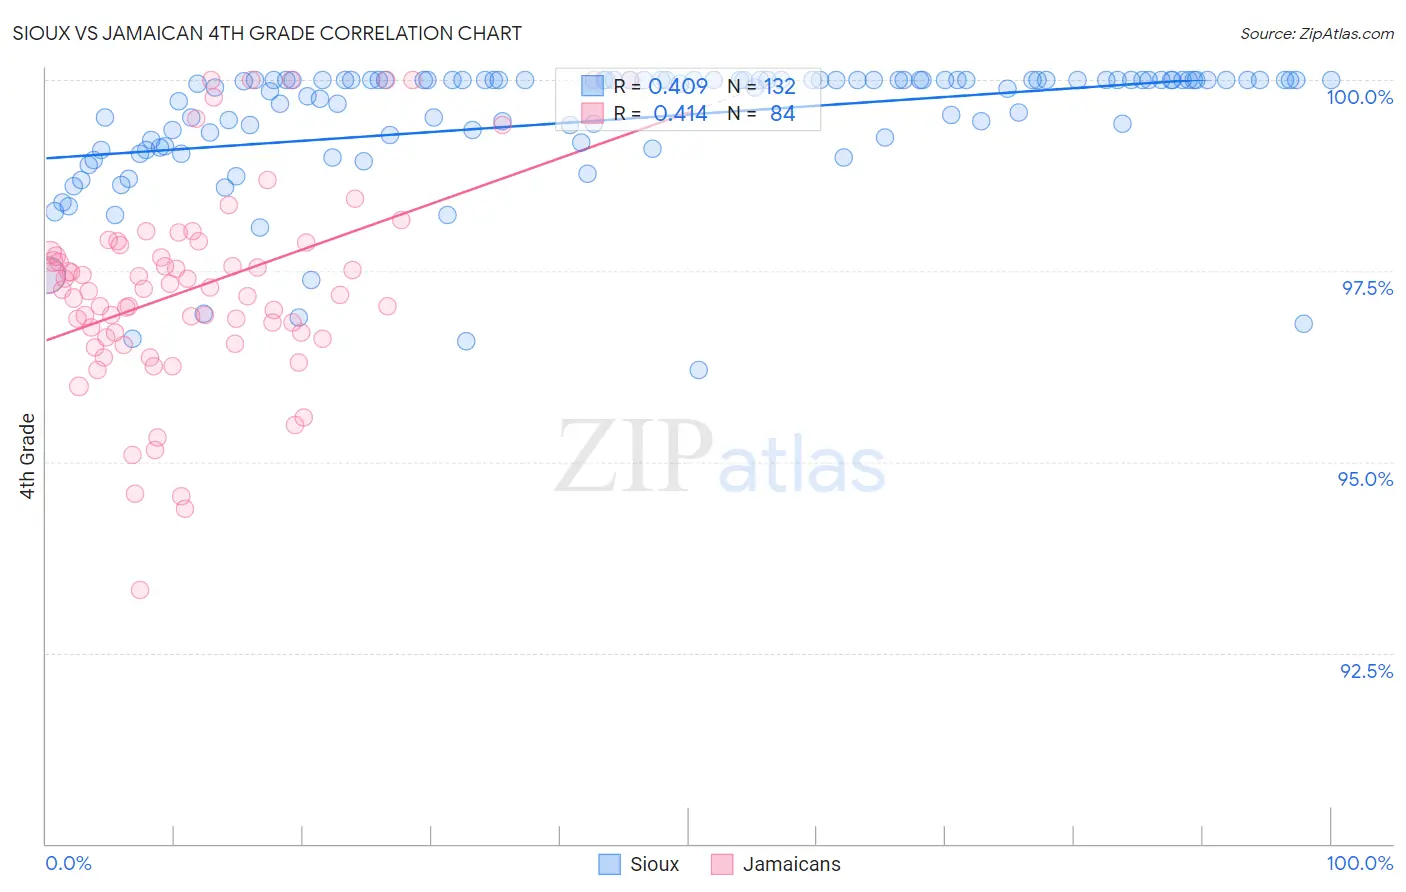
Sioux vs Jamaican 4th Grade Correlation Chart
The statistical analysis conducted on geographies consisting of 234,197,392 people shows a moderate positive correlation between the proportion of Sioux and percentage of population with at least 4th grade education in the United States with a correlation coefficient (R) of 0.409 and weighted average of 98.3%. Similarly, the statistical analysis conducted on geographies consisting of 368,084,189 people shows a moderate positive correlation between the proportion of Jamaicans and percentage of population with at least 4th grade education in the United States with a correlation coefficient (R) of 0.414 and weighted average of 97.1%, a difference of 1.3%.
4th Grade Correlation Summary
| Measurement | Sioux | Jamaican |
| Minimum | 96.2% | 93.3% |
| Maximum | 100.0% | 100.0% |
| Range | 3.8% | 6.7% |
| Mean | 99.5% | 97.3% |
| Median | 100.0% | 97.3% |
| Interquartile 25% (IQ1) | 99.2% | 96.7% |
| Interquartile 75% (IQ3) | 100.0% | 97.9% |
| Interquartile Range (IQR) | 0.84% | 1.2% |
| Standard Deviation (Sample) | 0.84% | 1.3% |
| Standard Deviation (Population) | 0.84% | 1.3% |
Similar Demographics by 4th Grade
Demographics Similar to Sioux by 4th Grade
In terms of 4th grade, the demographic groups most similar to Sioux are Finnish (98.3%, a difference of 0.010%), Danish (98.3%, a difference of 0.010%), Scotch-Irish (98.3%, a difference of 0.010%), Alaska Native (98.4%, a difference of 0.020%), and Lithuanian (98.3%, a difference of 0.020%).
| Demographics | Rating | Rank | 4th Grade |
| Scottish | 100.0 /100 | #16 | Exceptional 98.4% |
| Pennsylvania Germans | 100.0 /100 | #17 | Exceptional 98.4% |
| Poles | 100.0 /100 | #18 | Exceptional 98.4% |
| Irish | 100.0 /100 | #19 | Exceptional 98.4% |
| Alaska Natives | 100.0 /100 | #20 | Exceptional 98.4% |
| Lithuanians | 100.0 /100 | #21 | Exceptional 98.3% |
| Finns | 100.0 /100 | #22 | Exceptional 98.3% |
| Sioux | 100.0 /100 | #23 | Exceptional 98.3% |
| Danes | 100.0 /100 | #24 | Exceptional 98.3% |
| Scotch-Irish | 100.0 /100 | #25 | Exceptional 98.3% |
| Croatians | 100.0 /100 | #26 | Exceptional 98.3% |
| French Canadians | 100.0 /100 | #27 | Exceptional 98.3% |
| French | 100.0 /100 | #28 | Exceptional 98.3% |
| Czechs | 100.0 /100 | #29 | Exceptional 98.3% |
| Scandinavians | 100.0 /100 | #30 | Exceptional 98.3% |
Demographics Similar to Jamaicans by 4th Grade
In terms of 4th grade, the demographic groups most similar to Jamaicans are South American (97.1%, a difference of 0.0%), Immigrants from Liberia (97.1%, a difference of 0.0%), Immigrants from Middle Africa (97.1%, a difference of 0.0%), Immigrants from Africa (97.1%, a difference of 0.010%), and Immigrants from Senegal (97.1%, a difference of 0.010%).
| Demographics | Rating | Rank | 4th Grade |
| Immigrants | Eastern Africa | 1.2 /100 | #245 | Tragic 97.1% |
| Immigrants | Uruguay | 1.2 /100 | #246 | Tragic 97.1% |
| Ethiopians | 1.2 /100 | #247 | Tragic 97.1% |
| Immigrants | Asia | 1.2 /100 | #248 | Tragic 97.1% |
| Immigrants | Africa | 1.0 /100 | #249 | Tragic 97.1% |
| Immigrants | Senegal | 0.9 /100 | #250 | Tragic 97.1% |
| South Americans | 0.8 /100 | #251 | Tragic 97.1% |
| Jamaicans | 0.8 /100 | #252 | Tragic 97.1% |
| Immigrants | Liberia | 0.8 /100 | #253 | Tragic 97.1% |
| Immigrants | Middle Africa | 0.8 /100 | #254 | Tragic 97.1% |
| Peruvians | 0.7 /100 | #255 | Tragic 97.1% |
| Bolivians | 0.7 /100 | #256 | Tragic 97.1% |
| Immigrants | Congo | 0.5 /100 | #257 | Tragic 97.0% |
| Immigrants | Colombia | 0.5 /100 | #258 | Tragic 97.0% |
| Immigrants | Ethiopia | 0.4 /100 | #259 | Tragic 97.0% |