Mexican American Indian vs Immigrants from Panama 12th Grade, No Diploma
COMPARE
Mexican American Indian
Immigrants from Panama
12th Grade, No Diploma
12th Grade, No Diploma Comparison
Mexican American Indians
Immigrants from Panama
85.7%
12TH GRADE, NO DIPLOMA
0.0/ 100
METRIC RATING
325th/ 347
METRIC RANK
90.3%
12TH GRADE, NO DIPLOMA
4.8/ 100
METRIC RATING
224th/ 347
METRIC RANK
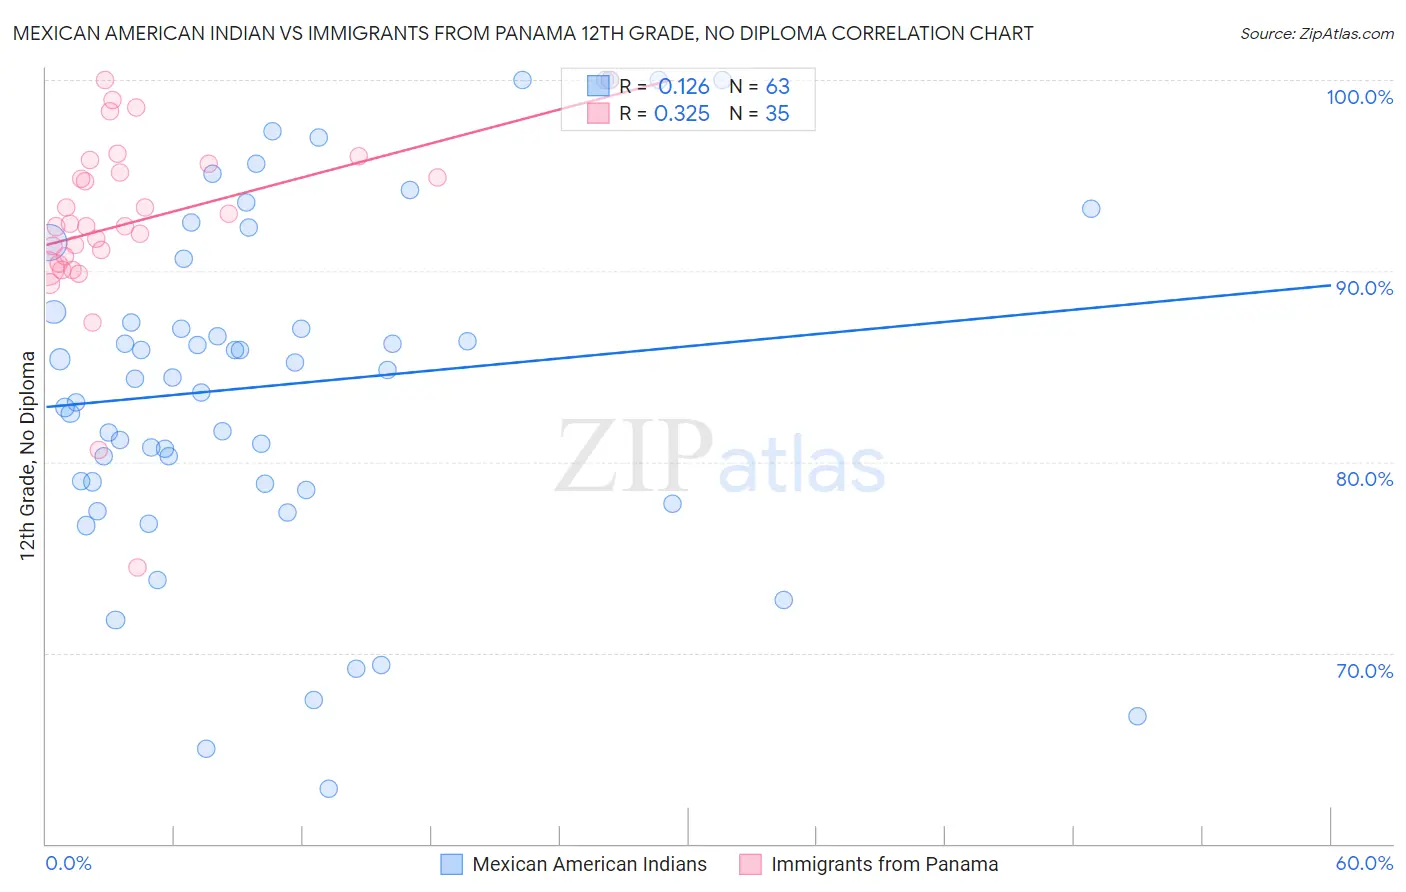
Mexican American Indian vs Immigrants from Panama 12th Grade, No Diploma Correlation Chart
The statistical analysis conducted on geographies consisting of 317,621,155 people shows a poor positive correlation between the proportion of Mexican American Indians and percentage of population with at least 12th grade (no diploma) education in the United States with a correlation coefficient (R) of 0.126 and weighted average of 85.7%. Similarly, the statistical analysis conducted on geographies consisting of 221,182,871 people shows a mild positive correlation between the proportion of Immigrants from Panama and percentage of population with at least 12th grade (no diploma) education in the United States with a correlation coefficient (R) of 0.325 and weighted average of 90.3%, a difference of 5.4%.
12th Grade, No Diploma Correlation Summary
| Measurement | Mexican American Indian | Immigrants from Panama |
| Minimum | 62.9% | 74.4% |
| Maximum | 100.0% | 100.0% |
| Range | 37.1% | 25.6% |
| Mean | 84.0% | 92.5% |
| Median | 84.4% | 92.3% |
| Interquartile 25% (IQ1) | 78.9% | 90.4% |
| Interquartile 75% (IQ3) | 90.6% | 95.6% |
| Interquartile Range (IQR) | 11.8% | 5.2% |
| Standard Deviation (Sample) | 9.1% | 5.0% |
| Standard Deviation (Population) | 9.0% | 4.9% |
Similar Demographics by 12th Grade, No Diploma
Demographics Similar to Mexican American Indians by 12th Grade, No Diploma
In terms of 12th grade, no diploma, the demographic groups most similar to Mexican American Indians are Dominican (85.7%, a difference of 0.020%), Lumbee (85.7%, a difference of 0.030%), Immigrants from Cabo Verde (85.8%, a difference of 0.070%), Honduran (85.5%, a difference of 0.22%), and Hispanic or Latino (85.4%, a difference of 0.32%).
| Demographics | Rating | Rank | 12th Grade, No Diploma |
| Belizeans | 0.0 /100 | #318 | Tragic 87.0% |
| Immigrants | Belize | 0.0 /100 | #319 | Tragic 87.0% |
| Immigrants | Nicaragua | 0.0 /100 | #320 | Tragic 86.6% |
| Puerto Ricans | 0.0 /100 | #321 | Tragic 86.5% |
| Central American Indians | 0.0 /100 | #322 | Tragic 86.5% |
| Yuman | 0.0 /100 | #323 | Tragic 86.5% |
| Immigrants | Cabo Verde | 0.0 /100 | #324 | Tragic 85.8% |
| Mexican American Indians | 0.0 /100 | #325 | Tragic 85.7% |
| Dominicans | 0.0 /100 | #326 | Tragic 85.7% |
| Lumbee | 0.0 /100 | #327 | Tragic 85.7% |
| Hondurans | 0.0 /100 | #328 | Tragic 85.5% |
| Hispanics or Latinos | 0.0 /100 | #329 | Tragic 85.4% |
| Immigrants | Azores | 0.0 /100 | #330 | Tragic 85.3% |
| Central Americans | 0.0 /100 | #331 | Tragic 85.2% |
| Immigrants | Honduras | 0.0 /100 | #332 | Tragic 85.0% |
Demographics Similar to Immigrants from Panama by 12th Grade, No Diploma
In terms of 12th grade, no diploma, the demographic groups most similar to Immigrants from Panama are Chickasaw (90.3%, a difference of 0.0%), Immigrants from Zaire (90.3%, a difference of 0.010%), South American (90.3%, a difference of 0.020%), Nigerian (90.3%, a difference of 0.020%), and Immigrants from Somalia (90.4%, a difference of 0.030%).
| Demographics | Rating | Rank | 12th Grade, No Diploma |
| Cherokee | 7.4 /100 | #217 | Tragic 90.5% |
| Immigrants | Cameroon | 7.4 /100 | #218 | Tragic 90.5% |
| Uruguayans | 7.0 /100 | #219 | Tragic 90.4% |
| Colombians | 6.6 /100 | #220 | Tragic 90.4% |
| Immigrants | Liberia | 5.7 /100 | #221 | Tragic 90.4% |
| Immigrants | Somalia | 5.3 /100 | #222 | Tragic 90.4% |
| South Americans | 5.0 /100 | #223 | Tragic 90.3% |
| Immigrants | Panama | 4.8 /100 | #224 | Tragic 90.3% |
| Chickasaw | 4.8 /100 | #225 | Tragic 90.3% |
| Immigrants | Zaire | 4.6 /100 | #226 | Tragic 90.3% |
| Nigerians | 4.5 /100 | #227 | Tragic 90.3% |
| Creek | 3.9 /100 | #228 | Tragic 90.3% |
| Immigrants | Bahamas | 3.6 /100 | #229 | Tragic 90.2% |
| Immigrants | Philippines | 2.8 /100 | #230 | Tragic 90.2% |
| Peruvians | 2.7 /100 | #231 | Tragic 90.2% |