Immigrants from Jamaica vs Puerto Rican 5th Grade
COMPARE
Immigrants from Jamaica
Puerto Rican
5th Grade
5th Grade Comparison
Immigrants from Jamaica
Puerto Ricans
96.8%
5TH GRADE
0.4/ 100
METRIC RATING
260th/ 347
METRIC RANK
96.1%
5TH GRADE
0.0/ 100
METRIC RATING
303rd/ 347
METRIC RANK
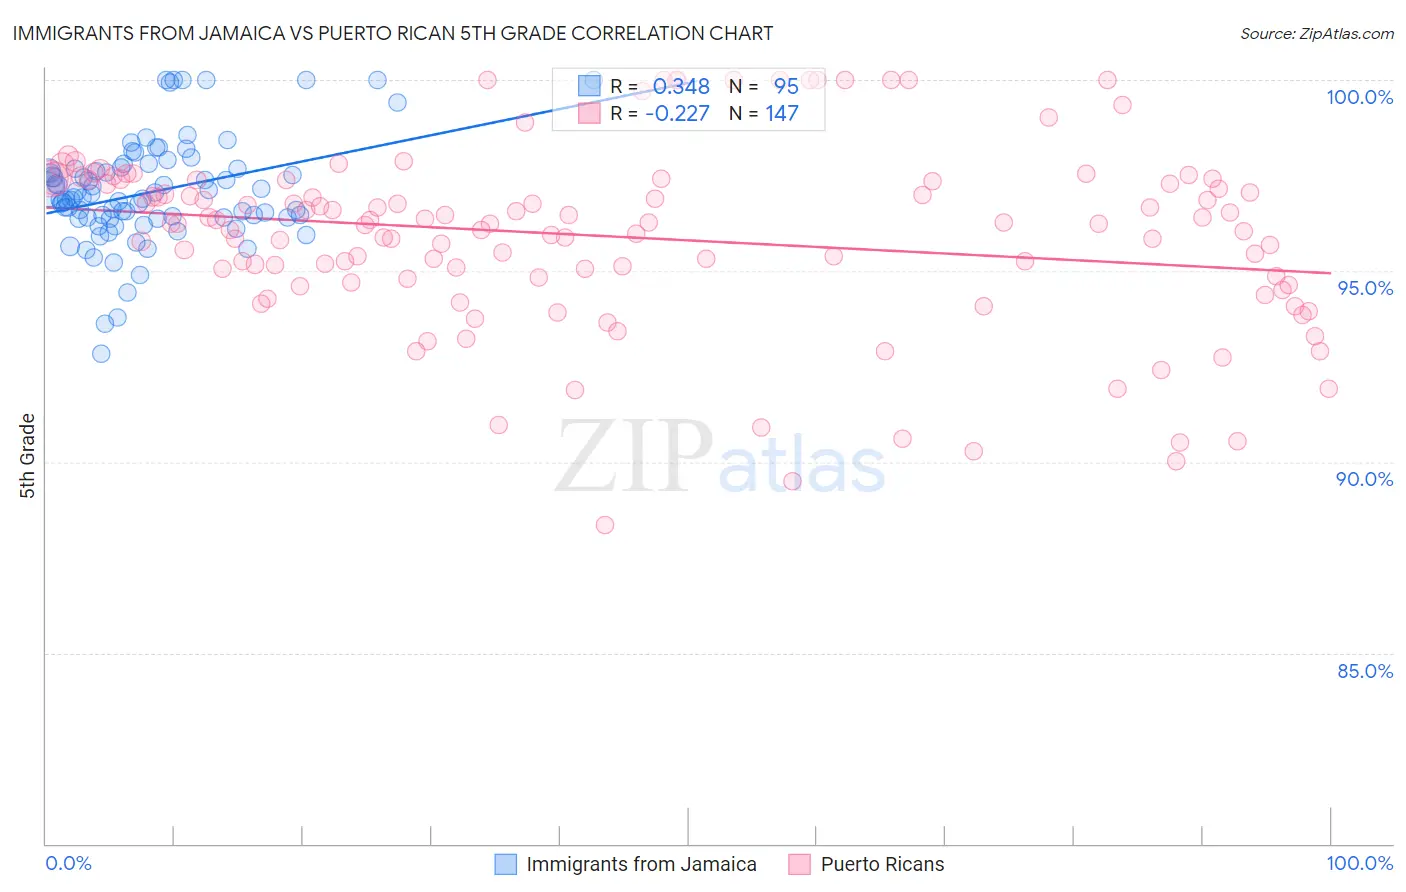
Immigrants from Jamaica vs Puerto Rican 5th Grade Correlation Chart
The statistical analysis conducted on geographies consisting of 301,829,538 people shows a mild positive correlation between the proportion of Immigrants from Jamaica and percentage of population with at least 5th grade education in the United States with a correlation coefficient (R) of 0.348 and weighted average of 96.8%. Similarly, the statistical analysis conducted on geographies consisting of 528,320,438 people shows a weak negative correlation between the proportion of Puerto Ricans and percentage of population with at least 5th grade education in the United States with a correlation coefficient (R) of -0.227 and weighted average of 96.1%, a difference of 0.71%.
5th Grade Correlation Summary
| Measurement | Immigrants from Jamaica | Puerto Rican |
| Minimum | 92.8% | 88.4% |
| Maximum | 100.0% | 100.0% |
| Range | 7.2% | 11.6% |
| Mean | 97.1% | 95.9% |
| Median | 96.9% | 96.2% |
| Interquartile 25% (IQ1) | 96.4% | 94.8% |
| Interquartile 75% (IQ3) | 97.7% | 97.4% |
| Interquartile Range (IQR) | 1.3% | 2.6% |
| Standard Deviation (Sample) | 1.4% | 2.4% |
| Standard Deviation (Population) | 1.4% | 2.4% |
Similar Demographics by 5th Grade
Demographics Similar to Immigrants from Jamaica by 5th Grade
In terms of 5th grade, the demographic groups most similar to Immigrants from Jamaica are Immigrants from Sierra Leone (96.8%, a difference of 0.0%), Immigrants from Colombia (96.8%, a difference of 0.0%), Immigrants from Uzbekistan (96.8%, a difference of 0.010%), Immigrants from Ethiopia (96.8%, a difference of 0.020%), and Immigrants from China (96.8%, a difference of 0.020%).
| Demographics | Rating | Rank | 5th Grade |
| Immigrants | Middle Africa | 0.8 /100 | #253 | Tragic 96.8% |
| Immigrants | Senegal | 0.8 /100 | #254 | Tragic 96.8% |
| South Americans | 0.7 /100 | #255 | Tragic 96.8% |
| Immigrants | Congo | 0.7 /100 | #256 | Tragic 96.8% |
| Peruvians | 0.6 /100 | #257 | Tragic 96.8% |
| Immigrants | Ethiopia | 0.5 /100 | #258 | Tragic 96.8% |
| Immigrants | China | 0.5 /100 | #259 | Tragic 96.8% |
| Immigrants | Jamaica | 0.4 /100 | #260 | Tragic 96.8% |
| Immigrants | Sierra Leone | 0.4 /100 | #261 | Tragic 96.8% |
| Immigrants | Colombia | 0.4 /100 | #262 | Tragic 96.8% |
| Immigrants | Uzbekistan | 0.3 /100 | #263 | Tragic 96.8% |
| West Indians | 0.3 /100 | #264 | Tragic 96.8% |
| Taiwanese | 0.3 /100 | #265 | Tragic 96.7% |
| Immigrants | Nigeria | 0.3 /100 | #266 | Tragic 96.7% |
| Immigrants | South America | 0.3 /100 | #267 | Tragic 96.7% |
Demographics Similar to Puerto Ricans by 5th Grade
In terms of 5th grade, the demographic groups most similar to Puerto Ricans are Guyanese (96.1%, a difference of 0.010%), Immigrants from Cuba (96.1%, a difference of 0.020%), Immigrants from Burma/Myanmar (96.1%, a difference of 0.030%), Sri Lankan (96.1%, a difference of 0.040%), and Immigrants from Laos (96.0%, a difference of 0.040%).
| Demographics | Rating | Rank | 5th Grade |
| Immigrants | South Eastern Asia | 0.0 /100 | #296 | Tragic 96.3% |
| Haitians | 0.0 /100 | #297 | Tragic 96.3% |
| Immigrants | Dominica | 0.0 /100 | #298 | Tragic 96.2% |
| Immigrants | Immigrants | 0.0 /100 | #299 | Tragic 96.2% |
| Sri Lankans | 0.0 /100 | #300 | Tragic 96.1% |
| Immigrants | Cuba | 0.0 /100 | #301 | Tragic 96.1% |
| Guyanese | 0.0 /100 | #302 | Tragic 96.1% |
| Puerto Ricans | 0.0 /100 | #303 | Tragic 96.1% |
| Immigrants | Burma/Myanmar | 0.0 /100 | #304 | Tragic 96.1% |
| Immigrants | Laos | 0.0 /100 | #305 | Tragic 96.0% |
| Immigrants | Haiti | 0.0 /100 | #306 | Tragic 96.0% |
| Immigrants | Caribbean | 0.0 /100 | #307 | Tragic 96.0% |
| Ecuadorians | 0.0 /100 | #308 | Tragic 96.0% |
| Immigrants | Guyana | 0.0 /100 | #309 | Tragic 96.0% |
| Indonesians | 0.0 /100 | #310 | Tragic 96.0% |