Menominee vs Immigrants from South Africa 12th Grade, No Diploma
COMPARE
Menominee
Immigrants from South Africa
12th Grade, No Diploma
12th Grade, No Diploma Comparison
Menominee
Immigrants from South Africa
91.9%
12TH GRADE, NO DIPLOMA
93.5/ 100
METRIC RATING
121st/ 347
METRIC RANK
92.7%
12TH GRADE, NO DIPLOMA
99.5/ 100
METRIC RATING
67th/ 347
METRIC RANK
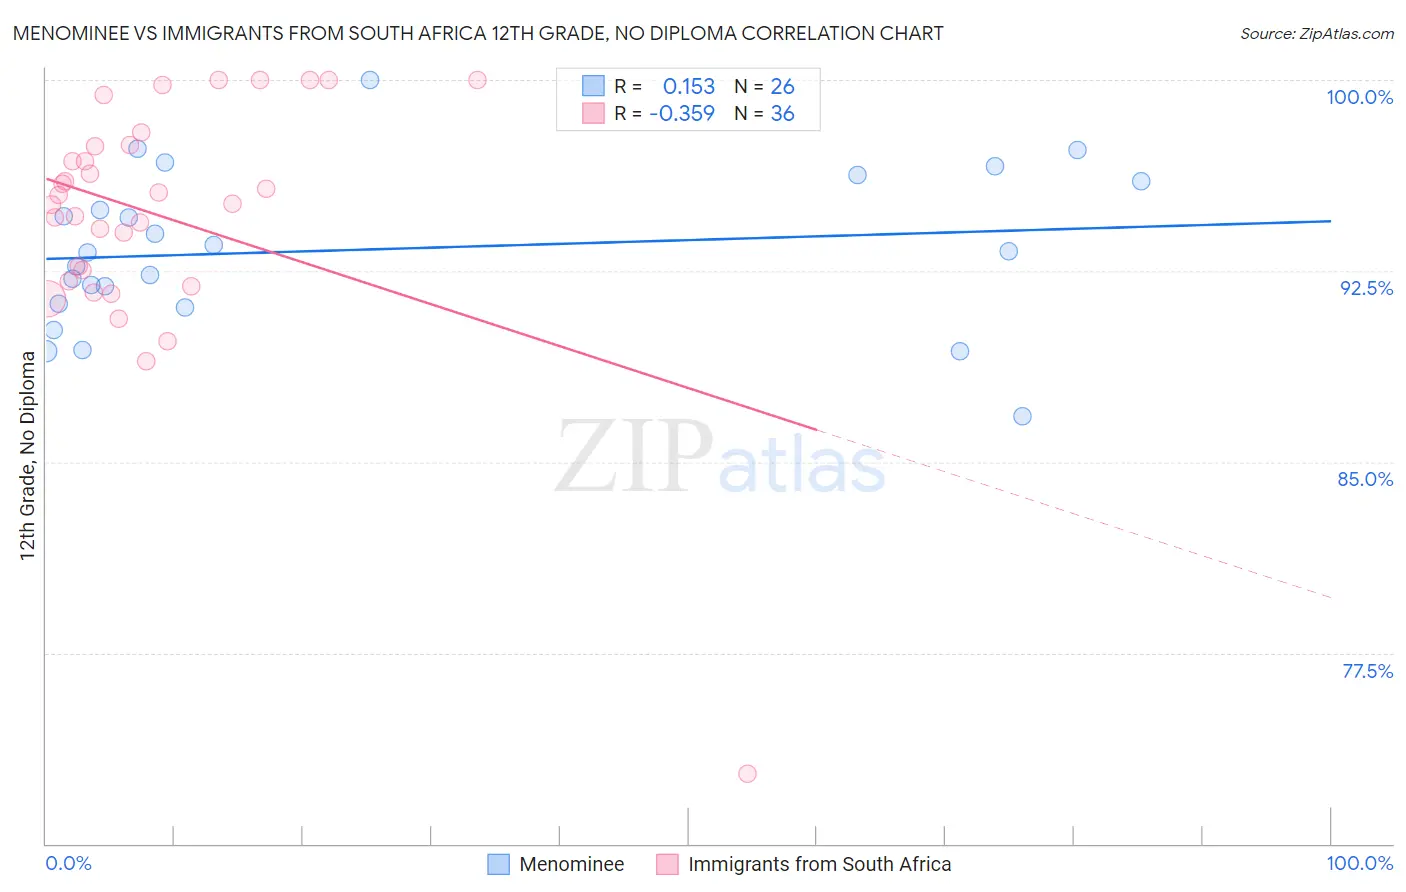
Menominee vs Immigrants from South Africa 12th Grade, No Diploma Correlation Chart
The statistical analysis conducted on geographies consisting of 45,778,979 people shows a poor positive correlation between the proportion of Menominee and percentage of population with at least 12th grade (no diploma) education in the United States with a correlation coefficient (R) of 0.153 and weighted average of 91.9%. Similarly, the statistical analysis conducted on geographies consisting of 233,321,693 people shows a mild negative correlation between the proportion of Immigrants from South Africa and percentage of population with at least 12th grade (no diploma) education in the United States with a correlation coefficient (R) of -0.359 and weighted average of 92.7%, a difference of 0.81%.
12th Grade, No Diploma Correlation Summary
| Measurement | Menominee | Immigrants from South Africa |
| Minimum | 86.8% | 72.7% |
| Maximum | 100.0% | 100.0% |
| Range | 13.2% | 27.3% |
| Mean | 93.3% | 94.7% |
| Median | 93.3% | 95.3% |
| Interquartile 25% (IQ1) | 91.2% | 92.3% |
| Interquartile 75% (IQ3) | 96.0% | 97.4% |
| Interquartile Range (IQR) | 4.8% | 5.1% |
| Standard Deviation (Sample) | 3.1% | 4.9% |
| Standard Deviation (Population) | 3.0% | 4.8% |
Similar Demographics by 12th Grade, No Diploma
Demographics Similar to Menominee by 12th Grade, No Diploma
In terms of 12th grade, no diploma, the demographic groups most similar to Menominee are Ottawa (91.9%, a difference of 0.020%), Immigrants from Kazakhstan (91.9%, a difference of 0.030%), Egyptian (91.9%, a difference of 0.050%), Immigrants from Ukraine (91.8%, a difference of 0.090%), and White/Caucasian (91.8%, a difference of 0.090%).
| Demographics | Rating | Rank | 12th Grade, No Diploma |
| Yugoslavians | 96.5 /100 | #114 | Exceptional 92.1% |
| Immigrants | Sri Lanka | 96.4 /100 | #115 | Exceptional 92.1% |
| Aleuts | 96.3 /100 | #116 | Exceptional 92.1% |
| Immigrants | Eastern Europe | 96.3 /100 | #117 | Exceptional 92.1% |
| Puget Sound Salish | 95.8 /100 | #118 | Exceptional 92.0% |
| Immigrants | Germany | 95.5 /100 | #119 | Exceptional 92.0% |
| Immigrants | Kazakhstan | 94.2 /100 | #120 | Exceptional 91.9% |
| Menominee | 93.5 /100 | #121 | Exceptional 91.9% |
| Ottawa | 93.1 /100 | #122 | Exceptional 91.9% |
| Egyptians | 92.5 /100 | #123 | Exceptional 91.9% |
| Immigrants | Ukraine | 91.6 /100 | #124 | Exceptional 91.8% |
| Whites/Caucasians | 91.6 /100 | #125 | Exceptional 91.8% |
| Basques | 91.3 /100 | #126 | Exceptional 91.8% |
| Immigrants | Jordan | 91.0 /100 | #127 | Exceptional 91.8% |
| Mongolians | 89.9 /100 | #128 | Excellent 91.8% |
Demographics Similar to Immigrants from South Africa by 12th Grade, No Diploma
In terms of 12th grade, no diploma, the demographic groups most similar to Immigrants from South Africa are Immigrants from Czechoslovakia (92.7%, a difference of 0.010%), Immigrants from Iran (92.7%, a difference of 0.010%), Czechoslovakian (92.6%, a difference of 0.010%), Immigrants from Latvia (92.6%, a difference of 0.020%), and Immigrants from South Central Asia (92.6%, a difference of 0.030%).
| Demographics | Rating | Rank | 12th Grade, No Diploma |
| Slavs | 99.7 /100 | #60 | Exceptional 92.8% |
| Immigrants | Japan | 99.7 /100 | #61 | Exceptional 92.8% |
| Ukrainians | 99.6 /100 | #62 | Exceptional 92.7% |
| Zimbabweans | 99.6 /100 | #63 | Exceptional 92.7% |
| Immigrants | Netherlands | 99.6 /100 | #64 | Exceptional 92.7% |
| Austrians | 99.6 /100 | #65 | Exceptional 92.7% |
| Soviet Union | 99.6 /100 | #66 | Exceptional 92.7% |
| Immigrants | South Africa | 99.5 /100 | #67 | Exceptional 92.7% |
| Immigrants | Czechoslovakia | 99.5 /100 | #68 | Exceptional 92.7% |
| Immigrants | Iran | 99.5 /100 | #69 | Exceptional 92.7% |
| Czechoslovakians | 99.5 /100 | #70 | Exceptional 92.6% |
| Immigrants | Latvia | 99.5 /100 | #71 | Exceptional 92.6% |
| Immigrants | South Central Asia | 99.5 /100 | #72 | Exceptional 92.6% |
| Burmese | 99.4 /100 | #73 | Exceptional 92.6% |
| Immigrants | Moldova | 99.4 /100 | #74 | Exceptional 92.6% |