Belgian vs Immigrants from South Africa 12th Grade, No Diploma
COMPARE
Belgian
Immigrants from South Africa
12th Grade, No Diploma
12th Grade, No Diploma Comparison
Belgians
Immigrants from South Africa
92.9%
12TH GRADE, NO DIPLOMA
99.8/ 100
METRIC RATING
47th/ 347
METRIC RANK
92.7%
12TH GRADE, NO DIPLOMA
99.5/ 100
METRIC RATING
67th/ 347
METRIC RANK
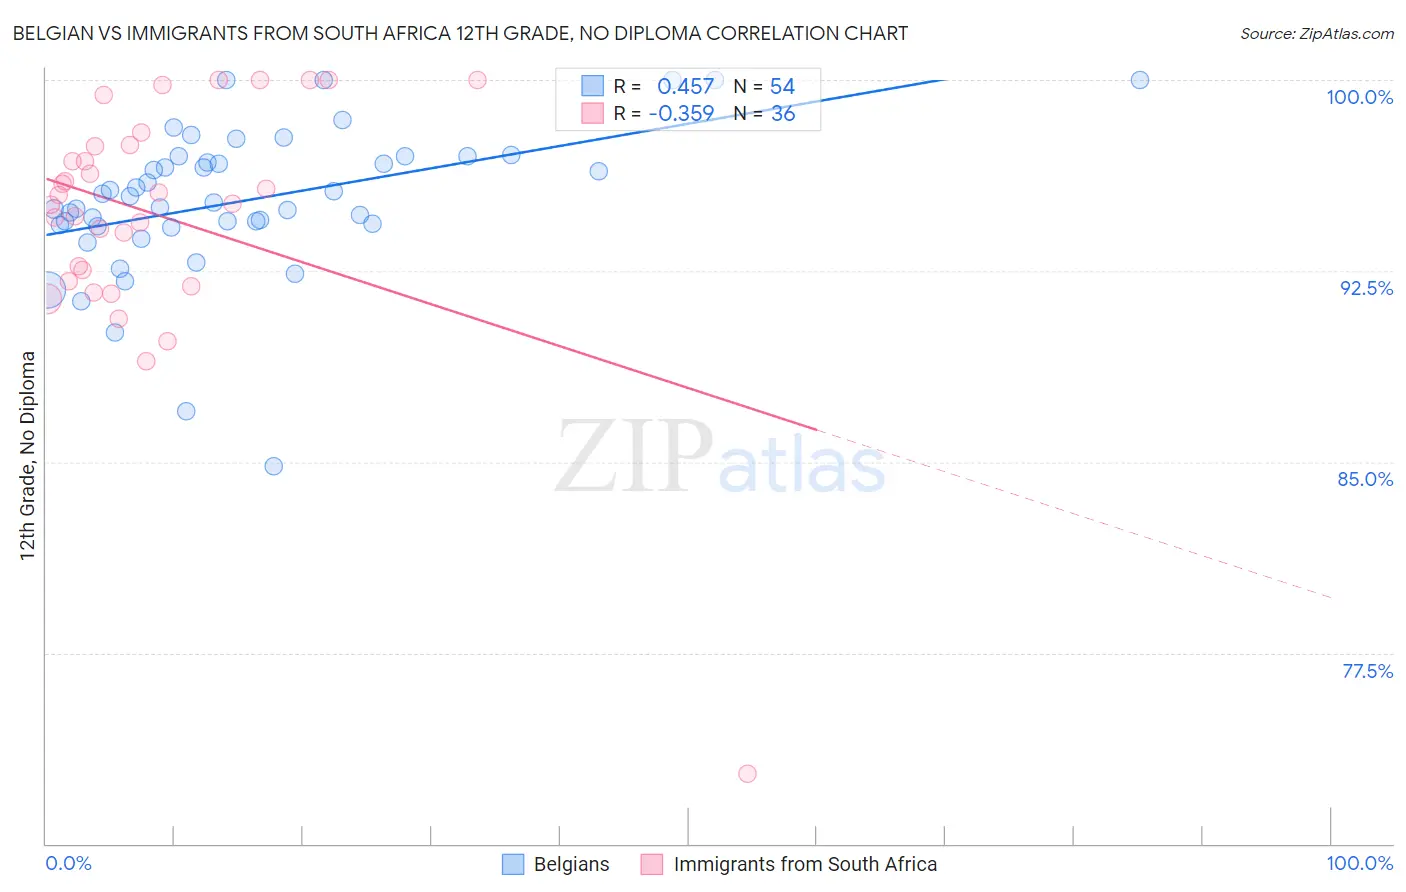
Belgian vs Immigrants from South Africa 12th Grade, No Diploma Correlation Chart
The statistical analysis conducted on geographies consisting of 356,019,518 people shows a moderate positive correlation between the proportion of Belgians and percentage of population with at least 12th grade (no diploma) education in the United States with a correlation coefficient (R) of 0.457 and weighted average of 92.9%. Similarly, the statistical analysis conducted on geographies consisting of 233,321,693 people shows a mild negative correlation between the proportion of Immigrants from South Africa and percentage of population with at least 12th grade (no diploma) education in the United States with a correlation coefficient (R) of -0.359 and weighted average of 92.7%, a difference of 0.26%.
12th Grade, No Diploma Correlation Summary
| Measurement | Belgian | Immigrants from South Africa |
| Minimum | 84.8% | 72.7% |
| Maximum | 100.0% | 100.0% |
| Range | 15.2% | 27.3% |
| Mean | 95.3% | 94.7% |
| Median | 95.3% | 95.3% |
| Interquartile 25% (IQ1) | 94.3% | 92.3% |
| Interquartile 75% (IQ3) | 97.0% | 97.4% |
| Interquartile Range (IQR) | 2.7% | 5.1% |
| Standard Deviation (Sample) | 2.9% | 4.9% |
| Standard Deviation (Population) | 2.9% | 4.8% |
Demographics Similar to Belgians and Immigrants from South Africa by 12th Grade, No Diploma
In terms of 12th grade, no diploma, the demographic groups most similar to Belgians are Australian (92.9%, a difference of 0.010%), Macedonian (92.9%, a difference of 0.020%), Tsimshian (92.9%, a difference of 0.030%), Immigrants from Belgium (92.9%, a difference of 0.040%), and Immigrants from Sweden (92.8%, a difference of 0.050%). Similarly, the demographic groups most similar to Immigrants from South Africa are Soviet Union (92.7%, a difference of 0.040%), Immigrants from Netherlands (92.7%, a difference of 0.060%), Austrian (92.7%, a difference of 0.060%), Zimbabwean (92.7%, a difference of 0.070%), and Ukrainian (92.7%, a difference of 0.090%).
| Demographics | Rating | Rank | 12th Grade, No Diploma |
| Belgians | 99.8 /100 | #47 | Exceptional 92.9% |
| Australians | 99.8 /100 | #48 | Exceptional 92.9% |
| Macedonians | 99.8 /100 | #49 | Exceptional 92.9% |
| Tsimshian | 99.8 /100 | #50 | Exceptional 92.9% |
| Immigrants | Belgium | 99.8 /100 | #51 | Exceptional 92.9% |
| Immigrants | Sweden | 99.8 /100 | #52 | Exceptional 92.8% |
| Serbians | 99.7 /100 | #53 | Exceptional 92.8% |
| Hungarians | 99.7 /100 | #54 | Exceptional 92.8% |
| Welsh | 99.7 /100 | #55 | Exceptional 92.8% |
| New Zealanders | 99.7 /100 | #56 | Exceptional 92.8% |
| Immigrants | Canada | 99.7 /100 | #57 | Exceptional 92.8% |
| Immigrants | Taiwan | 99.7 /100 | #58 | Exceptional 92.8% |
| Immigrants | North America | 99.7 /100 | #59 | Exceptional 92.8% |
| Slavs | 99.7 /100 | #60 | Exceptional 92.8% |
| Immigrants | Japan | 99.7 /100 | #61 | Exceptional 92.8% |
| Ukrainians | 99.6 /100 | #62 | Exceptional 92.7% |
| Zimbabweans | 99.6 /100 | #63 | Exceptional 92.7% |
| Immigrants | Netherlands | 99.6 /100 | #64 | Exceptional 92.7% |
| Austrians | 99.6 /100 | #65 | Exceptional 92.7% |
| Soviet Union | 99.6 /100 | #66 | Exceptional 92.7% |
| Immigrants | South Africa | 99.5 /100 | #67 | Exceptional 92.7% |