Menominee vs Central American Indian 12th Grade, No Diploma
COMPARE
Menominee
Central American Indian
12th Grade, No Diploma
12th Grade, No Diploma Comparison
Menominee
Central American Indians
91.9%
12TH GRADE, NO DIPLOMA
93.5/ 100
METRIC RATING
121st/ 347
METRIC RANK
86.5%
12TH GRADE, NO DIPLOMA
0.0/ 100
METRIC RATING
322nd/ 347
METRIC RANK
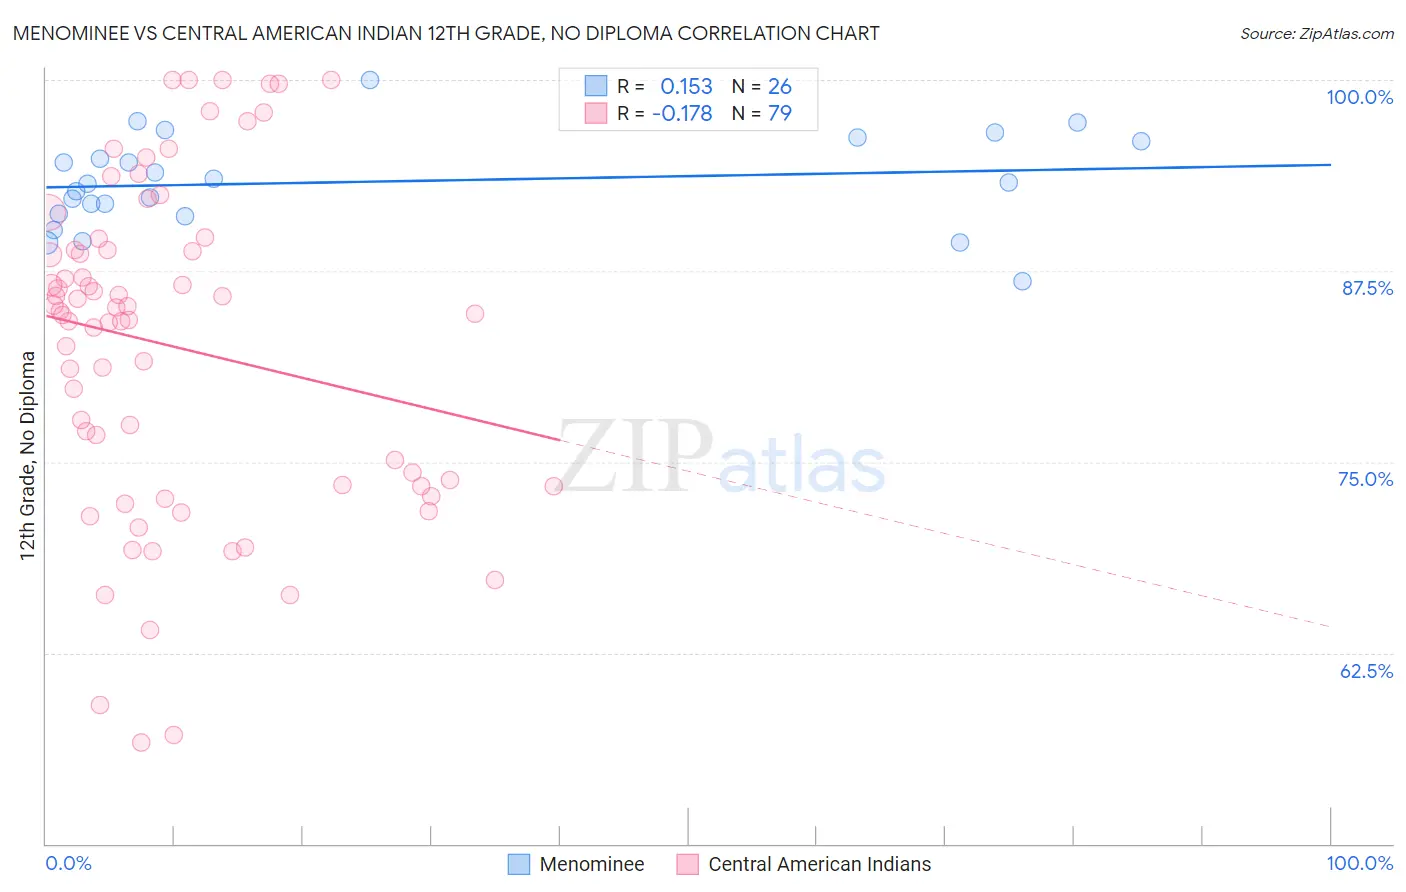
Menominee vs Central American Indian 12th Grade, No Diploma Correlation Chart
The statistical analysis conducted on geographies consisting of 45,778,979 people shows a poor positive correlation between the proportion of Menominee and percentage of population with at least 12th grade (no diploma) education in the United States with a correlation coefficient (R) of 0.153 and weighted average of 91.9%. Similarly, the statistical analysis conducted on geographies consisting of 326,142,643 people shows a poor negative correlation between the proportion of Central American Indians and percentage of population with at least 12th grade (no diploma) education in the United States with a correlation coefficient (R) of -0.178 and weighted average of 86.5%, a difference of 6.3%.
12th Grade, No Diploma Correlation Summary
| Measurement | Menominee | Central American Indian |
| Minimum | 86.8% | 56.6% |
| Maximum | 100.0% | 100.0% |
| Range | 13.2% | 43.4% |
| Mean | 93.3% | 82.5% |
| Median | 93.3% | 84.7% |
| Interquartile 25% (IQ1) | 91.2% | 73.4% |
| Interquartile 75% (IQ3) | 96.0% | 88.9% |
| Interquartile Range (IQR) | 4.8% | 15.4% |
| Standard Deviation (Sample) | 3.1% | 10.8% |
| Standard Deviation (Population) | 3.0% | 10.7% |
Similar Demographics by 12th Grade, No Diploma
Demographics Similar to Menominee by 12th Grade, No Diploma
In terms of 12th grade, no diploma, the demographic groups most similar to Menominee are Ottawa (91.9%, a difference of 0.020%), Immigrants from Kazakhstan (91.9%, a difference of 0.030%), Egyptian (91.9%, a difference of 0.050%), Immigrants from Ukraine (91.8%, a difference of 0.090%), and White/Caucasian (91.8%, a difference of 0.090%).
| Demographics | Rating | Rank | 12th Grade, No Diploma |
| Yugoslavians | 96.5 /100 | #114 | Exceptional 92.1% |
| Immigrants | Sri Lanka | 96.4 /100 | #115 | Exceptional 92.1% |
| Aleuts | 96.3 /100 | #116 | Exceptional 92.1% |
| Immigrants | Eastern Europe | 96.3 /100 | #117 | Exceptional 92.1% |
| Puget Sound Salish | 95.8 /100 | #118 | Exceptional 92.0% |
| Immigrants | Germany | 95.5 /100 | #119 | Exceptional 92.0% |
| Immigrants | Kazakhstan | 94.2 /100 | #120 | Exceptional 91.9% |
| Menominee | 93.5 /100 | #121 | Exceptional 91.9% |
| Ottawa | 93.1 /100 | #122 | Exceptional 91.9% |
| Egyptians | 92.5 /100 | #123 | Exceptional 91.9% |
| Immigrants | Ukraine | 91.6 /100 | #124 | Exceptional 91.8% |
| Whites/Caucasians | 91.6 /100 | #125 | Exceptional 91.8% |
| Basques | 91.3 /100 | #126 | Exceptional 91.8% |
| Immigrants | Jordan | 91.0 /100 | #127 | Exceptional 91.8% |
| Mongolians | 89.9 /100 | #128 | Excellent 91.8% |
Demographics Similar to Central American Indians by 12th Grade, No Diploma
In terms of 12th grade, no diploma, the demographic groups most similar to Central American Indians are Yuman (86.5%, a difference of 0.0%), Puerto Rican (86.5%, a difference of 0.080%), Immigrants from Nicaragua (86.6%, a difference of 0.10%), Immigrants from Belize (87.0%, a difference of 0.57%), and Belizean (87.0%, a difference of 0.65%).
| Demographics | Rating | Rank | 12th Grade, No Diploma |
| Nicaraguans | 0.0 /100 | #315 | Tragic 87.3% |
| Apache | 0.0 /100 | #316 | Tragic 87.3% |
| Navajo | 0.0 /100 | #317 | Tragic 87.1% |
| Belizeans | 0.0 /100 | #318 | Tragic 87.0% |
| Immigrants | Belize | 0.0 /100 | #319 | Tragic 87.0% |
| Immigrants | Nicaragua | 0.0 /100 | #320 | Tragic 86.6% |
| Puerto Ricans | 0.0 /100 | #321 | Tragic 86.5% |
| Central American Indians | 0.0 /100 | #322 | Tragic 86.5% |
| Yuman | 0.0 /100 | #323 | Tragic 86.5% |
| Immigrants | Cabo Verde | 0.0 /100 | #324 | Tragic 85.8% |
| Mexican American Indians | 0.0 /100 | #325 | Tragic 85.7% |
| Dominicans | 0.0 /100 | #326 | Tragic 85.7% |
| Lumbee | 0.0 /100 | #327 | Tragic 85.7% |
| Hondurans | 0.0 /100 | #328 | Tragic 85.5% |
| Hispanics or Latinos | 0.0 /100 | #329 | Tragic 85.4% |