Aleut vs Greek Professional Degree
COMPARE
Aleut
Greek
Professional Degree
Professional Degree Comparison
Aleuts
Greeks
3.6%
PROFESSIONAL DEGREE
0.7/ 100
METRIC RATING
268th/ 347
METRIC RANK
5.3%
PROFESSIONAL DEGREE
99.6/ 100
METRIC RATING
86th/ 347
METRIC RANK
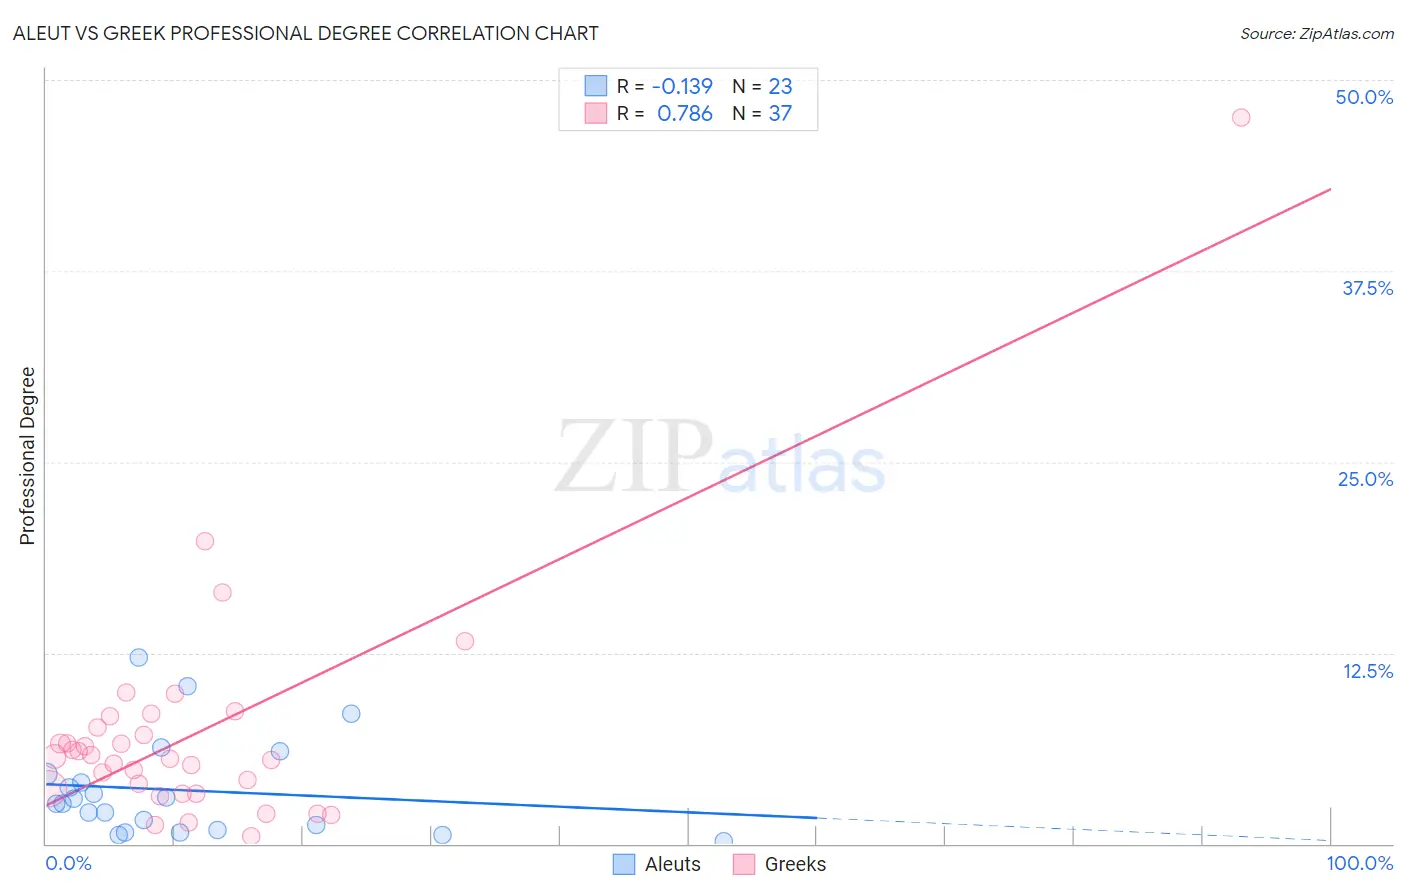
Aleut vs Greek Professional Degree Correlation Chart
The statistical analysis conducted on geographies consisting of 61,685,490 people shows a poor negative correlation between the proportion of Aleuts and percentage of population with at least professional degree education in the United States with a correlation coefficient (R) of -0.139 and weighted average of 3.6%. Similarly, the statistical analysis conducted on geographies consisting of 480,768,816 people shows a strong positive correlation between the proportion of Greeks and percentage of population with at least professional degree education in the United States with a correlation coefficient (R) of 0.786 and weighted average of 5.3%, a difference of 45.7%.
Professional Degree Correlation Summary
| Measurement | Aleut | Greek |
| Minimum | 0.13% | 0.52% |
| Maximum | 12.2% | 47.6% |
| Range | 12.1% | 47.0% |
| Mean | 3.5% | 7.2% |
| Median | 2.6% | 5.7% |
| Interquartile 25% (IQ1) | 0.93% | 3.4% |
| Interquartile 75% (IQ3) | 4.6% | 8.0% |
| Interquartile Range (IQR) | 3.7% | 4.6% |
| Standard Deviation (Sample) | 3.2% | 7.9% |
| Standard Deviation (Population) | 3.1% | 7.8% |
Similar Demographics by Professional Degree
Demographics Similar to Aleuts by Professional Degree
In terms of professional degree, the demographic groups most similar to Aleuts are Delaware (3.6%, a difference of 0.15%), Central American Indian (3.6%, a difference of 0.42%), Immigrants from Cuba (3.6%, a difference of 0.60%), Immigrants from Congo (3.6%, a difference of 0.74%), and Immigrants from Cambodia (3.6%, a difference of 0.78%).
| Demographics | Rating | Rank | Professional Degree |
| Immigrants | Guyana | 1.0 /100 | #261 | Tragic 3.7% |
| U.S. Virgin Islanders | 1.0 /100 | #262 | Tragic 3.7% |
| Hopi | 0.9 /100 | #263 | Tragic 3.6% |
| Immigrants | Cambodia | 0.9 /100 | #264 | Tragic 3.6% |
| Immigrants | Congo | 0.8 /100 | #265 | Tragic 3.6% |
| Central American Indians | 0.8 /100 | #266 | Tragic 3.6% |
| Delaware | 0.7 /100 | #267 | Tragic 3.6% |
| Aleuts | 0.7 /100 | #268 | Tragic 3.6% |
| Immigrants | Cuba | 0.6 /100 | #269 | Tragic 3.6% |
| Central Americans | 0.6 /100 | #270 | Tragic 3.6% |
| Belizeans | 0.5 /100 | #271 | Tragic 3.6% |
| Immigrants | Jamaica | 0.5 /100 | #272 | Tragic 3.6% |
| Americans | 0.5 /100 | #273 | Tragic 3.6% |
| Potawatomi | 0.5 /100 | #274 | Tragic 3.6% |
| Immigrants | Dominica | 0.5 /100 | #275 | Tragic 3.6% |
Demographics Similar to Greeks by Professional Degree
In terms of professional degree, the demographic groups most similar to Greeks are Immigrants from Zimbabwe (5.3%, a difference of 0.0%), Carpatho Rusyn (5.3%, a difference of 0.020%), Immigrants from Croatia (5.3%, a difference of 0.020%), Immigrants from Chile (5.3%, a difference of 0.11%), and Romanian (5.3%, a difference of 0.23%).
| Demographics | Rating | Rank | Professional Degree |
| Immigrants | North America | 99.7 /100 | #79 | Exceptional 5.3% |
| Immigrants | England | 99.6 /100 | #80 | Exceptional 5.3% |
| Immigrants | Brazil | 99.6 /100 | #81 | Exceptional 5.3% |
| Romanians | 99.6 /100 | #82 | Exceptional 5.3% |
| Carpatho Rusyns | 99.6 /100 | #83 | Exceptional 5.3% |
| Immigrants | Croatia | 99.6 /100 | #84 | Exceptional 5.3% |
| Immigrants | Zimbabwe | 99.6 /100 | #85 | Exceptional 5.3% |
| Greeks | 99.6 /100 | #86 | Exceptional 5.3% |
| Immigrants | Chile | 99.5 /100 | #87 | Exceptional 5.3% |
| Egyptians | 99.5 /100 | #88 | Exceptional 5.3% |
| Chileans | 99.5 /100 | #89 | Exceptional 5.3% |
| Immigrants | Scotland | 99.5 /100 | #90 | Exceptional 5.3% |
| Laotians | 99.5 /100 | #91 | Exceptional 5.2% |
| Immigrants | Eastern Europe | 99.5 /100 | #92 | Exceptional 5.2% |
| Northern Europeans | 99.3 /100 | #93 | Exceptional 5.2% |