Maltese vs Sudanese 12th Grade, No Diploma
COMPARE
Maltese
Sudanese
12th Grade, No Diploma
12th Grade, No Diploma Comparison
Maltese
Sudanese
93.3%
12TH GRADE, NO DIPLOMA
100.0/ 100
METRIC RATING
16th/ 347
METRIC RANK
91.0%
12TH GRADE, NO DIPLOMA
34.4/ 100
METRIC RATING
185th/ 347
METRIC RANK
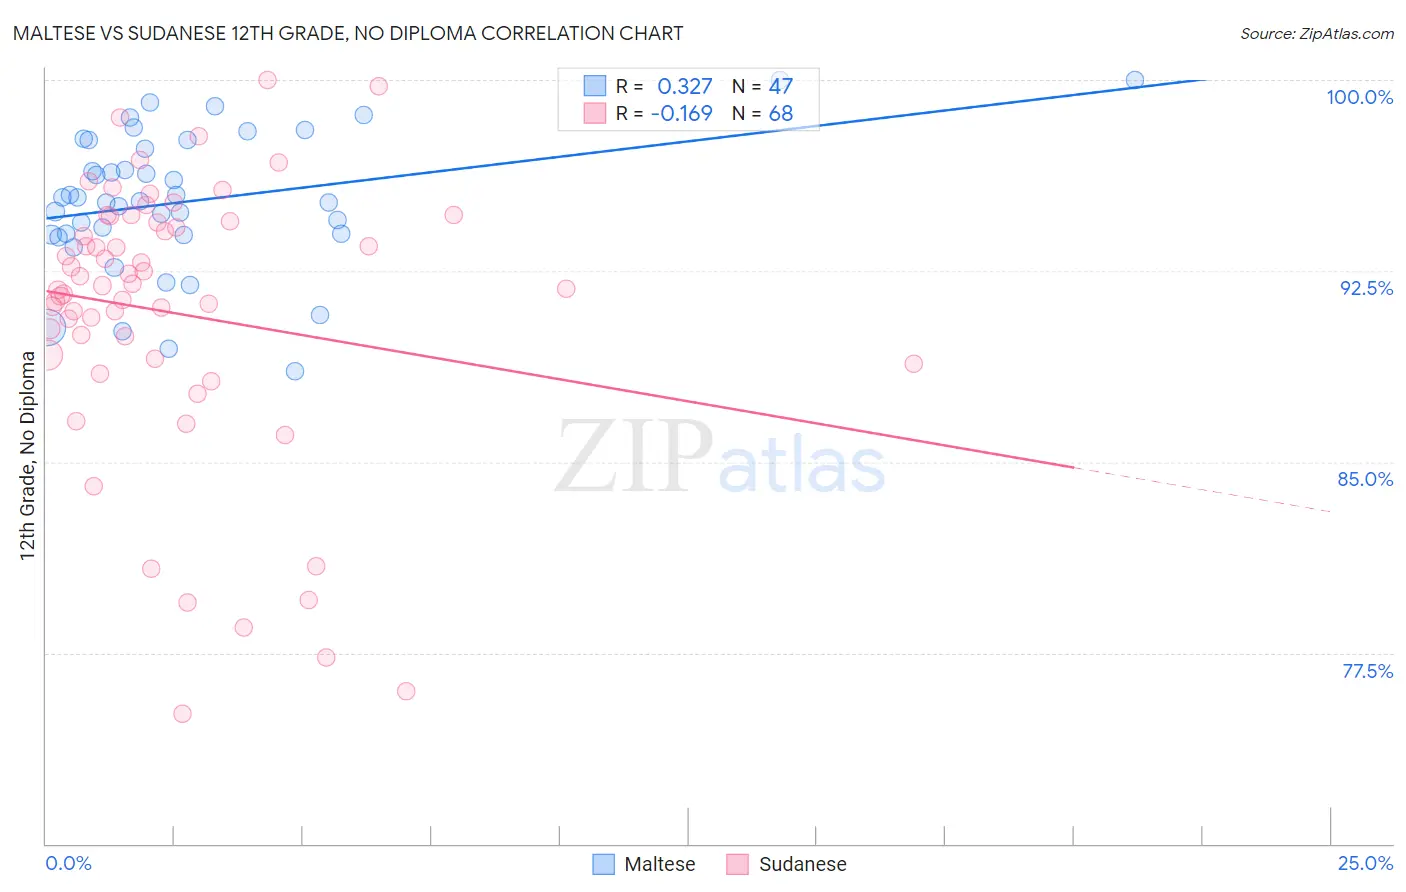
Maltese vs Sudanese 12th Grade, No Diploma Correlation Chart
The statistical analysis conducted on geographies consisting of 126,478,003 people shows a mild positive correlation between the proportion of Maltese and percentage of population with at least 12th grade (no diploma) education in the United States with a correlation coefficient (R) of 0.327 and weighted average of 93.3%. Similarly, the statistical analysis conducted on geographies consisting of 110,147,806 people shows a poor negative correlation between the proportion of Sudanese and percentage of population with at least 12th grade (no diploma) education in the United States with a correlation coefficient (R) of -0.169 and weighted average of 91.0%, a difference of 2.6%.
12th Grade, No Diploma Correlation Summary
| Measurement | Maltese | Sudanese |
| Minimum | 88.6% | 75.1% |
| Maximum | 100.0% | 100.0% |
| Range | 11.4% | 24.9% |
| Mean | 95.2% | 90.8% |
| Median | 95.2% | 91.9% |
| Interquartile 25% (IQ1) | 93.9% | 89.1% |
| Interquartile 75% (IQ3) | 97.6% | 94.4% |
| Interquartile Range (IQR) | 3.7% | 5.3% |
| Standard Deviation (Sample) | 2.7% | 5.5% |
| Standard Deviation (Population) | 2.7% | 5.5% |
Similar Demographics by 12th Grade, No Diploma
Demographics Similar to Maltese by 12th Grade, No Diploma
In terms of 12th grade, no diploma, the demographic groups most similar to Maltese are Luxembourger (93.3%, a difference of 0.020%), Finnish (93.4%, a difference of 0.040%), Immigrants from Singapore (93.3%, a difference of 0.050%), German (93.3%, a difference of 0.070%), and Filipino (93.2%, a difference of 0.10%).
| Demographics | Rating | Rank | 12th Grade, No Diploma |
| Latvians | 100.0 /100 | #9 | Exceptional 93.6% |
| Croatians | 100.0 /100 | #10 | Exceptional 93.5% |
| Poles | 100.0 /100 | #11 | Exceptional 93.5% |
| Eastern Europeans | 100.0 /100 | #12 | Exceptional 93.5% |
| Danes | 100.0 /100 | #13 | Exceptional 93.5% |
| Bulgarians | 100.0 /100 | #14 | Exceptional 93.5% |
| Finns | 100.0 /100 | #15 | Exceptional 93.4% |
| Maltese | 100.0 /100 | #16 | Exceptional 93.3% |
| Luxembourgers | 100.0 /100 | #17 | Exceptional 93.3% |
| Immigrants | Singapore | 99.9 /100 | #18 | Exceptional 93.3% |
| Germans | 99.9 /100 | #19 | Exceptional 93.3% |
| Filipinos | 99.9 /100 | #20 | Exceptional 93.2% |
| Italians | 99.9 /100 | #21 | Exceptional 93.2% |
| Estonians | 99.9 /100 | #22 | Exceptional 93.2% |
| Scandinavians | 99.9 /100 | #23 | Exceptional 93.2% |
Demographics Similar to Sudanese by 12th Grade, No Diploma
In terms of 12th grade, no diploma, the demographic groups most similar to Sudanese are Ethiopian (91.0%, a difference of 0.010%), Spaniard (91.0%, a difference of 0.020%), Potawatomi (91.0%, a difference of 0.020%), American (91.0%, a difference of 0.030%), and Immigrants from Uganda (90.9%, a difference of 0.040%).
| Demographics | Rating | Rank | 12th Grade, No Diploma |
| Spanish | 43.7 /100 | #178 | Average 91.1% |
| Immigrants | Chile | 43.3 /100 | #179 | Average 91.1% |
| Immigrants | Syria | 40.3 /100 | #180 | Average 91.1% |
| Guamanians/Chamorros | 39.5 /100 | #181 | Fair 91.0% |
| Immigrants | Nonimmigrants | 38.8 /100 | #182 | Fair 91.0% |
| Osage | 38.3 /100 | #183 | Fair 91.0% |
| Spaniards | 36.2 /100 | #184 | Fair 91.0% |
| Sudanese | 34.4 /100 | #185 | Fair 91.0% |
| Ethiopians | 33.9 /100 | #186 | Fair 91.0% |
| Potawatomi | 32.9 /100 | #187 | Fair 91.0% |
| Americans | 32.6 /100 | #188 | Fair 91.0% |
| Immigrants | Uganda | 31.6 /100 | #189 | Fair 90.9% |
| Afghans | 29.9 /100 | #190 | Fair 90.9% |
| Moroccans | 28.8 /100 | #191 | Fair 90.9% |
| Immigrants | Eastern Africa | 27.7 /100 | #192 | Fair 90.9% |