Malaysian vs Seminole 10th Grade
COMPARE
Malaysian
Seminole
10th Grade
10th Grade Comparison
Malaysians
Seminole
92.2%
10TH GRADE
0.1/ 100
METRIC RATING
280th/ 347
METRIC RANK
93.3%
10TH GRADE
10.2/ 100
METRIC RATING
219th/ 347
METRIC RANK
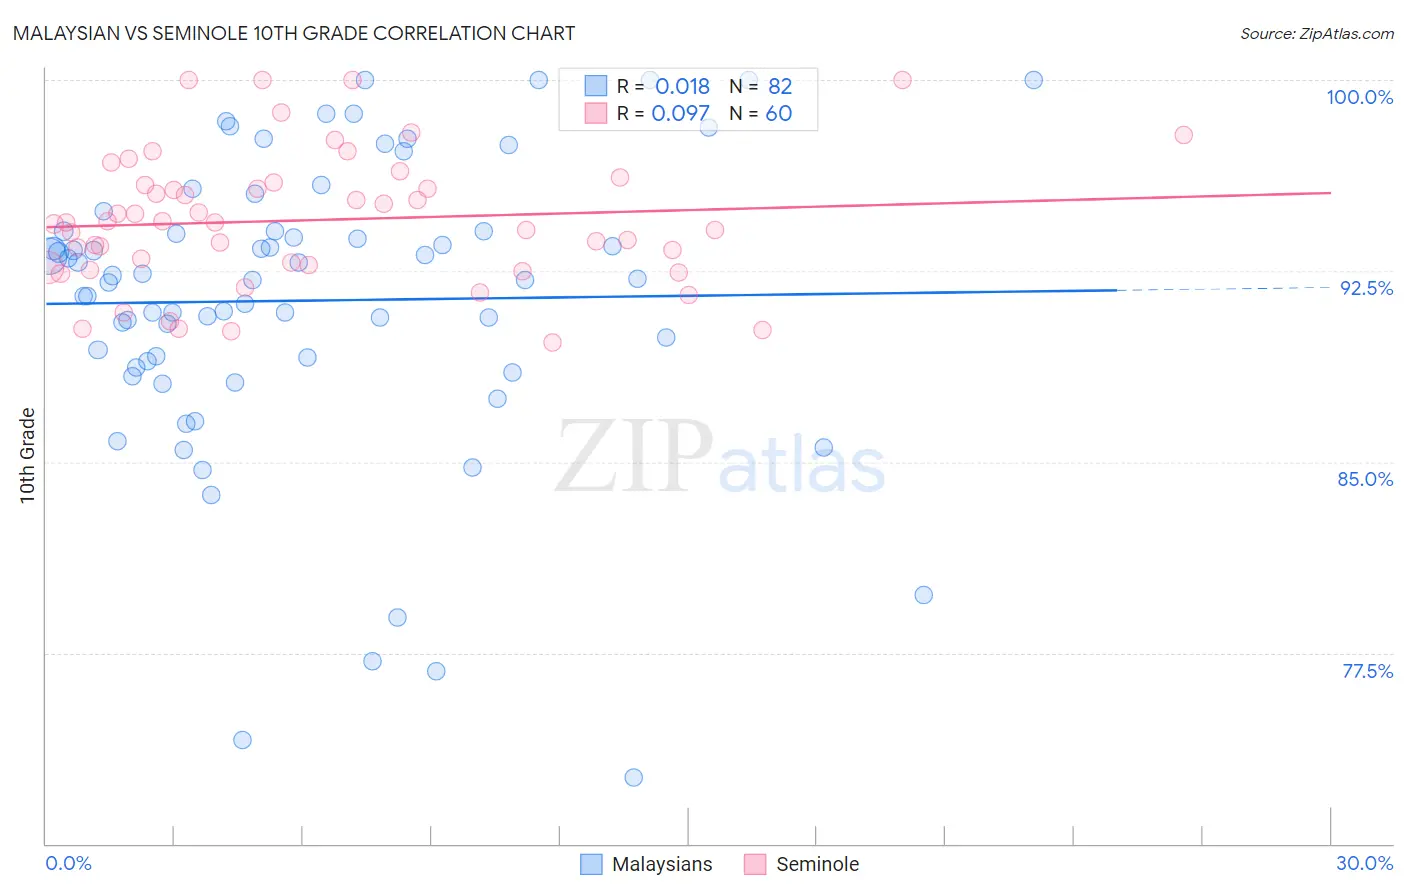
Malaysian vs Seminole 10th Grade Correlation Chart
The statistical analysis conducted on geographies consisting of 226,109,984 people shows no correlation between the proportion of Malaysians and percentage of population with at least 10th grade education in the United States with a correlation coefficient (R) of 0.018 and weighted average of 92.2%. Similarly, the statistical analysis conducted on geographies consisting of 118,314,042 people shows a slight positive correlation between the proportion of Seminole and percentage of population with at least 10th grade education in the United States with a correlation coefficient (R) of 0.097 and weighted average of 93.3%, a difference of 1.2%.
10th Grade Correlation Summary
| Measurement | Malaysian | Seminole |
| Minimum | 72.6% | 89.7% |
| Maximum | 100.0% | 100.0% |
| Range | 27.4% | 10.3% |
| Mean | 91.3% | 94.5% |
| Median | 92.2% | 94.4% |
| Interquartile 25% (IQ1) | 89.0% | 92.7% |
| Interquartile 75% (IQ3) | 94.1% | 95.9% |
| Interquartile Range (IQR) | 5.1% | 3.3% |
| Standard Deviation (Sample) | 5.8% | 2.6% |
| Standard Deviation (Population) | 5.7% | 2.6% |
Similar Demographics by 10th Grade
Demographics Similar to Malaysians by 10th Grade
In terms of 10th grade, the demographic groups most similar to Malaysians are Bangladeshi (92.2%, a difference of 0.010%), Native/Alaskan (92.2%, a difference of 0.030%), Immigrants from Peru (92.2%, a difference of 0.030%), Barbadian (92.2%, a difference of 0.040%), and Navajo (92.3%, a difference of 0.070%).
| Demographics | Rating | Rank | 10th Grade |
| Trinidadians and Tobagonians | 0.2 /100 | #273 | Tragic 92.4% |
| Immigrants | Congo | 0.2 /100 | #274 | Tragic 92.4% |
| West Indians | 0.2 /100 | #275 | Tragic 92.4% |
| Immigrants | Trinidad and Tobago | 0.1 /100 | #276 | Tragic 92.3% |
| Navajo | 0.1 /100 | #277 | Tragic 92.3% |
| Barbadians | 0.1 /100 | #278 | Tragic 92.2% |
| Natives/Alaskans | 0.1 /100 | #279 | Tragic 92.2% |
| Malaysians | 0.1 /100 | #280 | Tragic 92.2% |
| Bangladeshis | 0.1 /100 | #281 | Tragic 92.2% |
| Immigrants | Peru | 0.1 /100 | #282 | Tragic 92.2% |
| Immigrants | St. Vincent and the Grenadines | 0.0 /100 | #283 | Tragic 92.1% |
| Immigrants | Barbados | 0.0 /100 | #284 | Tragic 92.1% |
| Immigrants | South Eastern Asia | 0.0 /100 | #285 | Tragic 92.1% |
| Yuman | 0.0 /100 | #286 | Tragic 92.0% |
| Pennsylvania Germans | 0.0 /100 | #287 | Tragic 91.9% |
Demographics Similar to Seminole by 10th Grade
In terms of 10th grade, the demographic groups most similar to Seminole are Immigrants from Liberia (93.3%, a difference of 0.0%), Tongan (93.3%, a difference of 0.020%), Portuguese (93.3%, a difference of 0.040%), Immigrants from Southern Europe (93.2%, a difference of 0.040%), and Ethiopian (93.2%, a difference of 0.060%).
| Demographics | Rating | Rank | 10th Grade |
| Immigrants | Zaire | 16.7 /100 | #212 | Poor 93.4% |
| Immigrants | Asia | 15.7 /100 | #213 | Poor 93.4% |
| Immigrants | Bahamas | 15.2 /100 | #214 | Poor 93.4% |
| Immigrants | Oceania | 15.1 /100 | #215 | Poor 93.4% |
| Immigrants | Eastern Africa | 14.7 /100 | #216 | Poor 93.4% |
| Portuguese | 12.1 /100 | #217 | Poor 93.3% |
| Immigrants | Liberia | 10.2 /100 | #218 | Poor 93.3% |
| Seminole | 10.2 /100 | #219 | Poor 93.3% |
| Tongans | 9.5 /100 | #220 | Tragic 93.3% |
| Immigrants | Southern Europe | 8.9 /100 | #221 | Tragic 93.2% |
| Ethiopians | 7.9 /100 | #222 | Tragic 93.2% |
| Immigrants | Sierra Leone | 7.6 /100 | #223 | Tragic 93.2% |
| Bolivians | 6.7 /100 | #224 | Tragic 93.2% |
| Somalis | 6.2 /100 | #225 | Tragic 93.2% |
| Koreans | 6.1 /100 | #226 | Tragic 93.2% |