Malaysian vs Immigrants from Belize 4th Grade
COMPARE
Malaysian
Immigrants from Belize
4th Grade
4th Grade Comparison
Malaysians
Immigrants from Belize
96.7%
4TH GRADE
0.0/ 100
METRIC RATING
292nd/ 347
METRIC RANK
96.0%
4TH GRADE
0.0/ 100
METRIC RATING
324th/ 347
METRIC RANK
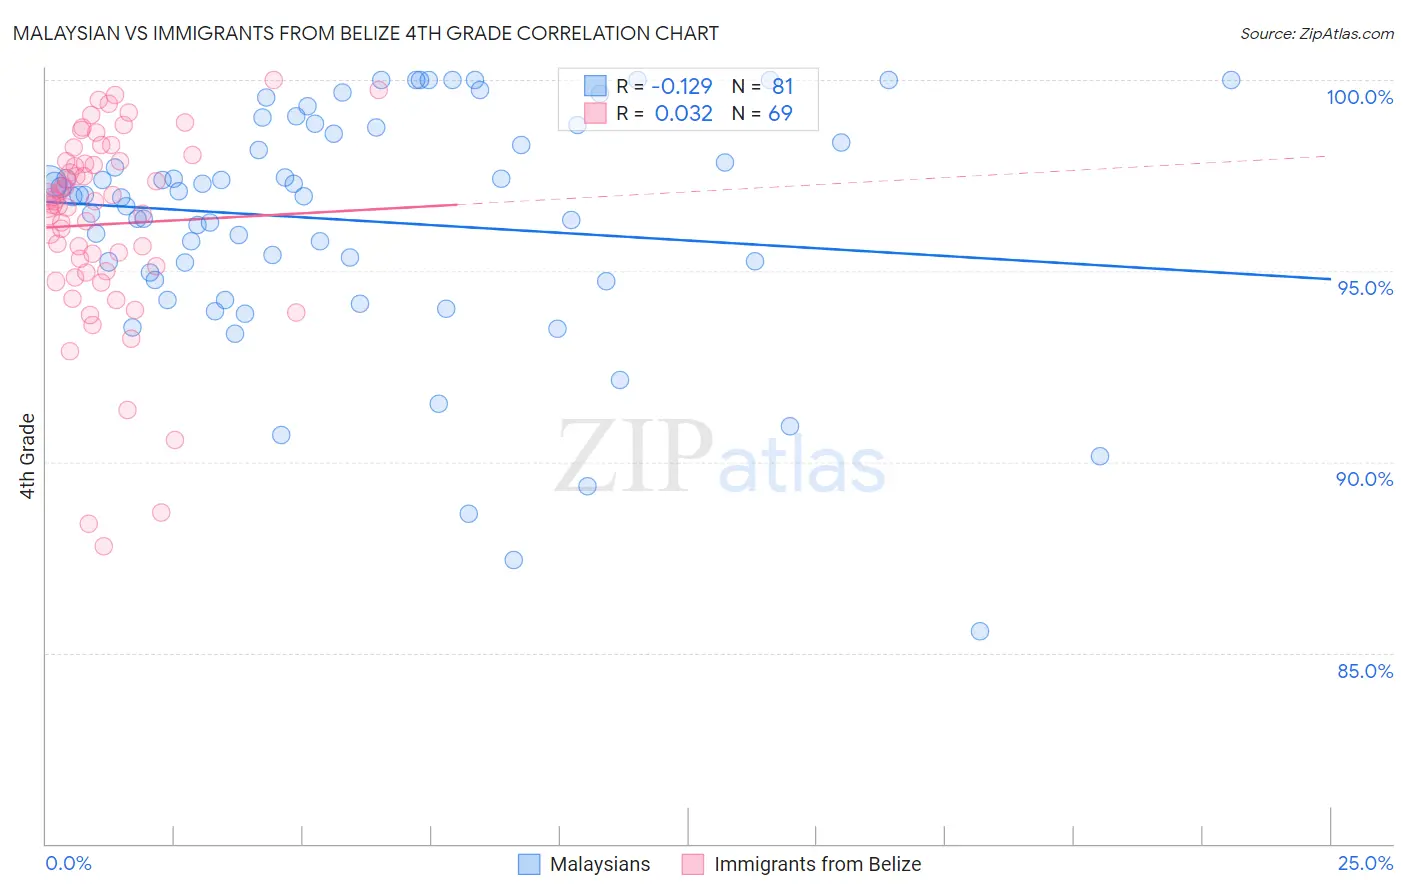
Malaysian vs Immigrants from Belize 4th Grade Correlation Chart
The statistical analysis conducted on geographies consisting of 226,107,000 people shows a poor negative correlation between the proportion of Malaysians and percentage of population with at least 4th grade education in the United States with a correlation coefficient (R) of -0.129 and weighted average of 96.7%. Similarly, the statistical analysis conducted on geographies consisting of 130,328,311 people shows no correlation between the proportion of Immigrants from Belize and percentage of population with at least 4th grade education in the United States with a correlation coefficient (R) of 0.032 and weighted average of 96.0%, a difference of 0.74%.
4th Grade Correlation Summary
| Measurement | Malaysian | Immigrants from Belize |
| Minimum | 85.6% | 87.8% |
| Maximum | 100.0% | 100.0% |
| Range | 14.4% | 12.2% |
| Mean | 96.3% | 96.2% |
| Median | 97.0% | 96.7% |
| Interquartile 25% (IQ1) | 94.9% | 95.0% |
| Interquartile 75% (IQ3) | 98.7% | 97.9% |
| Interquartile Range (IQR) | 3.8% | 2.9% |
| Standard Deviation (Sample) | 3.1% | 2.6% |
| Standard Deviation (Population) | 3.1% | 2.6% |
Similar Demographics by 4th Grade
Demographics Similar to Malaysians by 4th Grade
In terms of 4th grade, the demographic groups most similar to Malaysians are Immigrants from Grenada (96.7%, a difference of 0.010%), Puerto Rican (96.7%, a difference of 0.020%), British West Indian (96.7%, a difference of 0.040%), Immigrants from Eritrea (96.7%, a difference of 0.040%), and Immigrants from West Indies (96.7%, a difference of 0.050%).
| Demographics | Rating | Rank | 4th Grade |
| Immigrants | Barbados | 0.0 /100 | #285 | Tragic 96.8% |
| Immigrants | Thailand | 0.0 /100 | #286 | Tragic 96.8% |
| Houma | 0.0 /100 | #287 | Tragic 96.8% |
| Immigrants | Afghanistan | 0.0 /100 | #288 | Tragic 96.8% |
| Immigrants | West Indies | 0.0 /100 | #289 | Tragic 96.7% |
| British West Indians | 0.0 /100 | #290 | Tragic 96.7% |
| Immigrants | Grenada | 0.0 /100 | #291 | Tragic 96.7% |
| Malaysians | 0.0 /100 | #292 | Tragic 96.7% |
| Puerto Ricans | 0.0 /100 | #293 | Tragic 96.7% |
| Immigrants | Eritrea | 0.0 /100 | #294 | Tragic 96.7% |
| Immigrants | Portugal | 0.0 /100 | #295 | Tragic 96.6% |
| Somalis | 0.0 /100 | #296 | Tragic 96.6% |
| Immigrants | Somalia | 0.0 /100 | #297 | Tragic 96.5% |
| Haitians | 0.0 /100 | #298 | Tragic 96.5% |
| Immigrants | Dominica | 0.0 /100 | #299 | Tragic 96.5% |
Demographics Similar to Immigrants from Belize by 4th Grade
In terms of 4th grade, the demographic groups most similar to Immigrants from Belize are Immigrants from Nicaragua (96.0%, a difference of 0.010%), Dominican (96.0%, a difference of 0.010%), Hispanic or Latino (96.0%, a difference of 0.020%), Japanese (96.0%, a difference of 0.030%), and Immigrants from Vietnam (96.0%, a difference of 0.030%).
| Demographics | Rating | Rank | 4th Grade |
| Central American Indians | 0.0 /100 | #317 | Tragic 96.2% |
| Immigrants | Azores | 0.0 /100 | #318 | Tragic 96.1% |
| Belizeans | 0.0 /100 | #319 | Tragic 96.1% |
| Bangladeshis | 0.0 /100 | #320 | Tragic 96.1% |
| Japanese | 0.0 /100 | #321 | Tragic 96.0% |
| Immigrants | Vietnam | 0.0 /100 | #322 | Tragic 96.0% |
| Immigrants | Nicaragua | 0.0 /100 | #323 | Tragic 96.0% |
| Immigrants | Belize | 0.0 /100 | #324 | Tragic 96.0% |
| Dominicans | 0.0 /100 | #325 | Tragic 96.0% |
| Hispanics or Latinos | 0.0 /100 | #326 | Tragic 96.0% |
| Hondurans | 0.0 /100 | #327 | Tragic 96.0% |
| Mexican American Indians | 0.0 /100 | #328 | Tragic 95.8% |
| Immigrants | Cambodia | 0.0 /100 | #329 | Tragic 95.8% |
| Immigrants | Fiji | 0.0 /100 | #330 | Tragic 95.8% |
| Immigrants | Armenia | 0.0 /100 | #331 | Tragic 95.8% |