Malaysian vs Ethiopian 2nd Grade
COMPARE
Malaysian
Ethiopian
2nd Grade
2nd Grade Comparison
Malaysians
Ethiopians
97.1%
2ND GRADE
0.0/ 100
METRIC RATING
294th/ 347
METRIC RANK
97.5%
2ND GRADE
1.2/ 100
METRIC RATING
241st/ 347
METRIC RANK
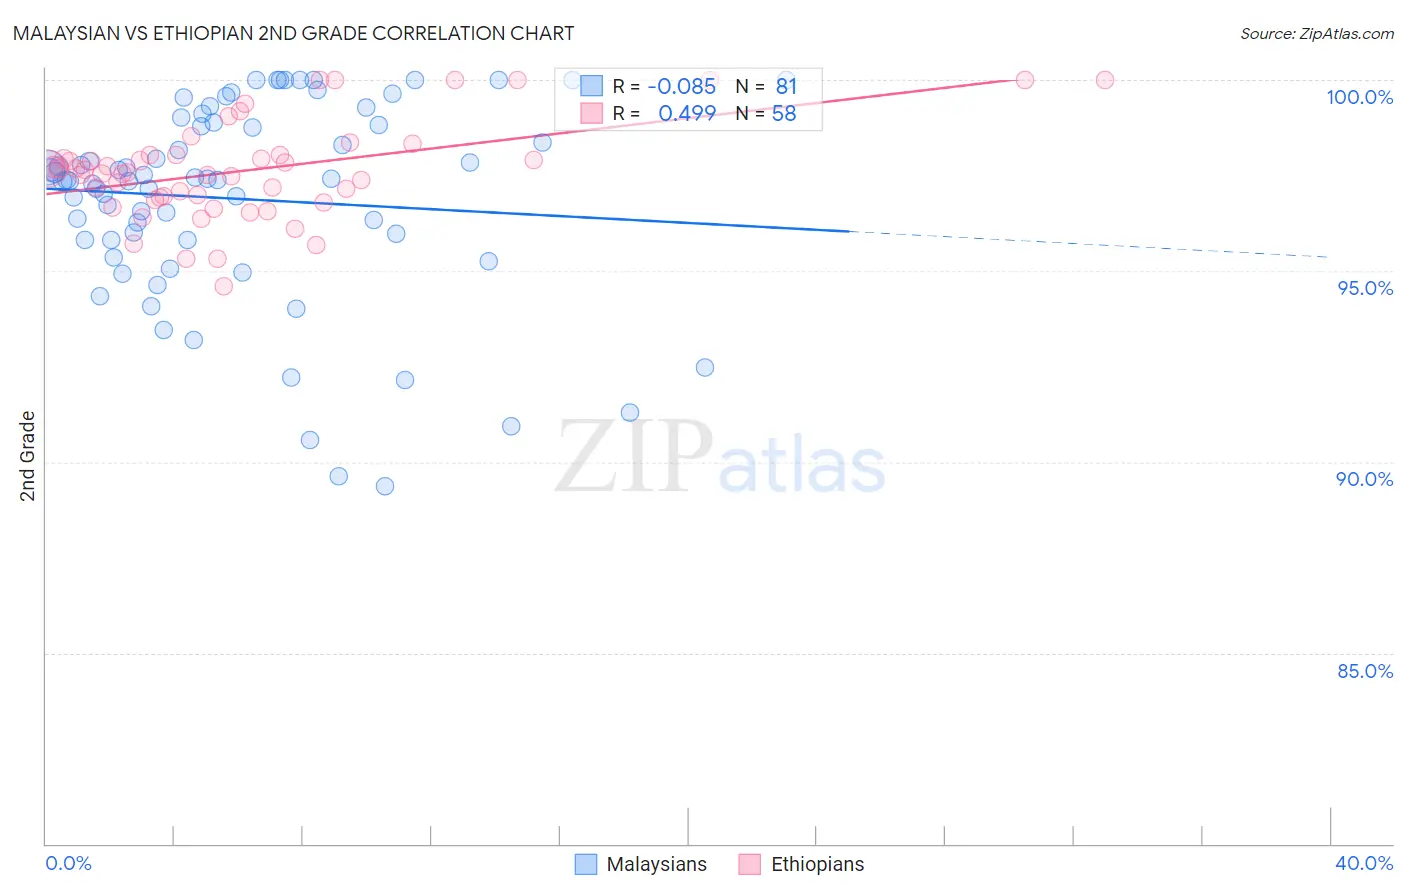
Malaysian vs Ethiopian 2nd Grade Correlation Chart
The statistical analysis conducted on geographies consisting of 226,107,000 people shows a slight negative correlation between the proportion of Malaysians and percentage of population with at least 2nd grade education in the United States with a correlation coefficient (R) of -0.085 and weighted average of 97.1%. Similarly, the statistical analysis conducted on geographies consisting of 223,120,541 people shows a moderate positive correlation between the proportion of Ethiopians and percentage of population with at least 2nd grade education in the United States with a correlation coefficient (R) of 0.499 and weighted average of 97.5%, a difference of 0.41%.
2nd Grade Correlation Summary
| Measurement | Malaysian | Ethiopian |
| Minimum | 89.4% | 94.6% |
| Maximum | 100.0% | 100.0% |
| Range | 10.6% | 5.4% |
| Mean | 96.9% | 97.6% |
| Median | 97.4% | 97.6% |
| Interquartile 25% (IQ1) | 95.8% | 96.9% |
| Interquartile 75% (IQ3) | 98.9% | 98.0% |
| Interquartile Range (IQR) | 3.1% | 1.1% |
| Standard Deviation (Sample) | 2.6% | 1.3% |
| Standard Deviation (Population) | 2.6% | 1.2% |
Similar Demographics by 2nd Grade
Demographics Similar to Malaysians by 2nd Grade
In terms of 2nd grade, the demographic groups most similar to Malaysians are British West Indian (97.2%, a difference of 0.020%), Immigrants from Grenada (97.1%, a difference of 0.020%), Immigrants from Eritrea (97.2%, a difference of 0.040%), Immigrants from Afghanistan (97.2%, a difference of 0.060%), and Immigrants (97.1%, a difference of 0.060%).
| Demographics | Rating | Rank | 2nd Grade |
| Immigrants | Portugal | 0.0 /100 | #287 | Tragic 97.2% |
| Immigrants | Thailand | 0.0 /100 | #288 | Tragic 97.2% |
| Houma | 0.0 /100 | #289 | Tragic 97.2% |
| Immigrants | St. Vincent and the Grenadines | 0.0 /100 | #290 | Tragic 97.2% |
| Immigrants | Afghanistan | 0.0 /100 | #291 | Tragic 97.2% |
| Immigrants | Eritrea | 0.0 /100 | #292 | Tragic 97.2% |
| British West Indians | 0.0 /100 | #293 | Tragic 97.2% |
| Malaysians | 0.0 /100 | #294 | Tragic 97.1% |
| Immigrants | Grenada | 0.0 /100 | #295 | Tragic 97.1% |
| Immigrants | Immigrants | 0.0 /100 | #296 | Tragic 97.1% |
| Immigrants | Cuba | 0.0 /100 | #297 | Tragic 97.0% |
| Immigrants | Dominica | 0.0 /100 | #298 | Tragic 97.0% |
| Haitians | 0.0 /100 | #299 | Tragic 97.0% |
| Immigrants | South Eastern Asia | 0.0 /100 | #300 | Tragic 97.0% |
| Central American Indians | 0.0 /100 | #301 | Tragic 97.0% |
Demographics Similar to Ethiopians by 2nd Grade
In terms of 2nd grade, the demographic groups most similar to Ethiopians are Immigrants from Indonesia (97.5%, a difference of 0.0%), Korean (97.5%, a difference of 0.010%), Asian (97.5%, a difference of 0.010%), Nigerian (97.6%, a difference of 0.020%), and U.S. Virgin Islander (97.6%, a difference of 0.020%).
| Demographics | Rating | Rank | 2nd Grade |
| Immigrants | Malaysia | 2.0 /100 | #234 | Tragic 97.6% |
| Colombians | 1.9 /100 | #235 | Tragic 97.6% |
| Nigerians | 1.7 /100 | #236 | Tragic 97.6% |
| U.S. Virgin Islanders | 1.6 /100 | #237 | Tragic 97.6% |
| Immigrants | Eastern Asia | 1.6 /100 | #238 | Tragic 97.6% |
| Liberians | 1.6 /100 | #239 | Tragic 97.6% |
| Koreans | 1.5 /100 | #240 | Tragic 97.5% |
| Ethiopians | 1.2 /100 | #241 | Tragic 97.5% |
| Immigrants | Indonesia | 1.2 /100 | #242 | Tragic 97.5% |
| Asians | 1.1 /100 | #243 | Tragic 97.5% |
| Immigrants | Iraq | 1.0 /100 | #244 | Tragic 97.5% |
| Immigrants | Eastern Africa | 0.9 /100 | #245 | Tragic 97.5% |
| South Americans | 0.9 /100 | #246 | Tragic 97.5% |
| Immigrants | Senegal | 0.9 /100 | #247 | Tragic 97.5% |
| Immigrants | Middle Africa | 0.9 /100 | #248 | Tragic 97.5% |