Belizean vs Ethiopian 2nd Grade
COMPARE
Belizean
Ethiopian
2nd Grade
2nd Grade Comparison
Belizeans
Ethiopians
96.8%
2ND GRADE
0.0/ 100
METRIC RATING
309th/ 347
METRIC RANK
97.5%
2ND GRADE
1.2/ 100
METRIC RATING
241st/ 347
METRIC RANK
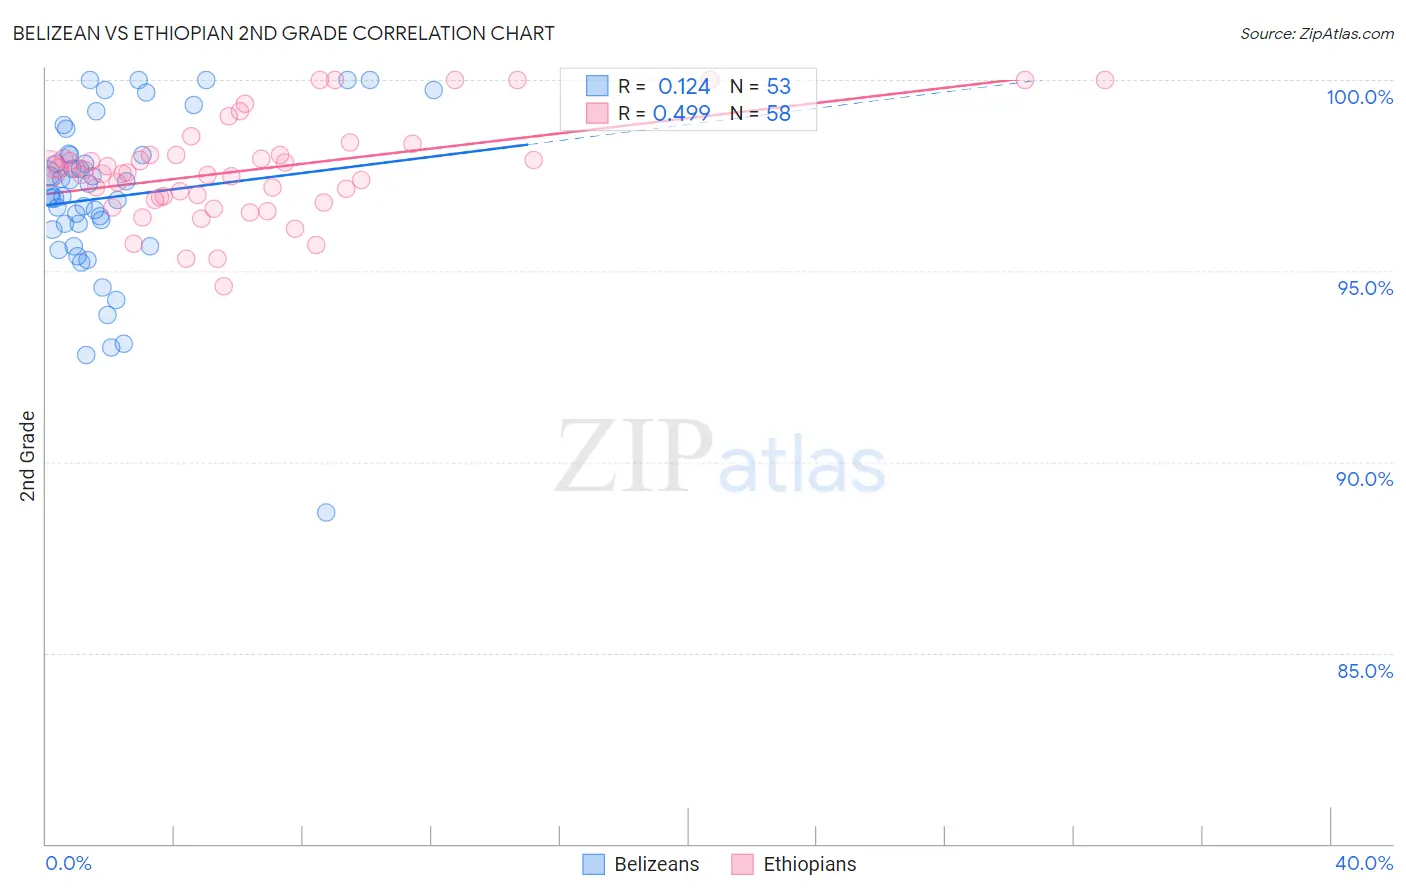
Belizean vs Ethiopian 2nd Grade Correlation Chart
The statistical analysis conducted on geographies consisting of 144,224,236 people shows a poor positive correlation between the proportion of Belizeans and percentage of population with at least 2nd grade education in the United States with a correlation coefficient (R) of 0.124 and weighted average of 96.8%. Similarly, the statistical analysis conducted on geographies consisting of 223,120,541 people shows a moderate positive correlation between the proportion of Ethiopians and percentage of population with at least 2nd grade education in the United States with a correlation coefficient (R) of 0.499 and weighted average of 97.5%, a difference of 0.72%.
2nd Grade Correlation Summary
| Measurement | Belizean | Ethiopian |
| Minimum | 88.7% | 94.6% |
| Maximum | 100.0% | 100.0% |
| Range | 11.3% | 5.4% |
| Mean | 96.9% | 97.6% |
| Median | 97.0% | 97.6% |
| Interquartile 25% (IQ1) | 95.9% | 96.9% |
| Interquartile 75% (IQ3) | 98.1% | 98.0% |
| Interquartile Range (IQR) | 2.2% | 1.1% |
| Standard Deviation (Sample) | 2.2% | 1.3% |
| Standard Deviation (Population) | 2.2% | 1.2% |
Similar Demographics by 2nd Grade
Demographics Similar to Belizeans by 2nd Grade
In terms of 2nd grade, the demographic groups most similar to Belizeans are Sri Lankan (96.8%, a difference of 0.0%), Immigrants from the Azores (96.8%, a difference of 0.010%), Immigrants from Haiti (96.8%, a difference of 0.010%), Guyanese (96.8%, a difference of 0.010%), and Cape Verdean (96.8%, a difference of 0.020%).
| Demographics | Rating | Rank | 2nd Grade |
| Somalis | 0.0 /100 | #302 | Tragic 97.0% |
| Ecuadorians | 0.0 /100 | #303 | Tragic 96.9% |
| Immigrants | Caribbean | 0.0 /100 | #304 | Tragic 96.9% |
| Nicaraguans | 0.0 /100 | #305 | Tragic 96.9% |
| Immigrants | Somalia | 0.0 /100 | #306 | Tragic 96.9% |
| Immigrants | Azores | 0.0 /100 | #307 | Tragic 96.8% |
| Immigrants | Haiti | 0.0 /100 | #308 | Tragic 96.8% |
| Belizeans | 0.0 /100 | #309 | Tragic 96.8% |
| Sri Lankans | 0.0 /100 | #310 | Tragic 96.8% |
| Guyanese | 0.0 /100 | #311 | Tragic 96.8% |
| Cape Verdeans | 0.0 /100 | #312 | Tragic 96.8% |
| Hispanics or Latinos | 0.0 /100 | #313 | Tragic 96.8% |
| Immigrants | Ecuador | 0.0 /100 | #314 | Tragic 96.8% |
| Immigrants | Belize | 0.0 /100 | #315 | Tragic 96.8% |
| Hondurans | 0.0 /100 | #316 | Tragic 96.7% |
Demographics Similar to Ethiopians by 2nd Grade
In terms of 2nd grade, the demographic groups most similar to Ethiopians are Immigrants from Indonesia (97.5%, a difference of 0.0%), Korean (97.5%, a difference of 0.010%), Asian (97.5%, a difference of 0.010%), Nigerian (97.6%, a difference of 0.020%), and U.S. Virgin Islander (97.6%, a difference of 0.020%).
| Demographics | Rating | Rank | 2nd Grade |
| Immigrants | Malaysia | 2.0 /100 | #234 | Tragic 97.6% |
| Colombians | 1.9 /100 | #235 | Tragic 97.6% |
| Nigerians | 1.7 /100 | #236 | Tragic 97.6% |
| U.S. Virgin Islanders | 1.6 /100 | #237 | Tragic 97.6% |
| Immigrants | Eastern Asia | 1.6 /100 | #238 | Tragic 97.6% |
| Liberians | 1.6 /100 | #239 | Tragic 97.6% |
| Koreans | 1.5 /100 | #240 | Tragic 97.5% |
| Ethiopians | 1.2 /100 | #241 | Tragic 97.5% |
| Immigrants | Indonesia | 1.2 /100 | #242 | Tragic 97.5% |
| Asians | 1.1 /100 | #243 | Tragic 97.5% |
| Immigrants | Iraq | 1.0 /100 | #244 | Tragic 97.5% |
| Immigrants | Eastern Africa | 0.9 /100 | #245 | Tragic 97.5% |
| South Americans | 0.9 /100 | #246 | Tragic 97.5% |
| Immigrants | Senegal | 0.9 /100 | #247 | Tragic 97.5% |
| Immigrants | Middle Africa | 0.9 /100 | #248 | Tragic 97.5% |