Lithuanian vs Immigrants from Western Europe Nursery School
COMPARE
Lithuanian
Immigrants from Western Europe
Nursery School
Nursery School Comparison
Lithuanians
Immigrants from Western Europe
98.6%
NURSERY SCHOOL
100.0/ 100
METRIC RATING
22nd/ 347
METRIC RANK
98.3%
NURSERY SCHOOL
98.8/ 100
METRIC RATING
90th/ 347
METRIC RANK
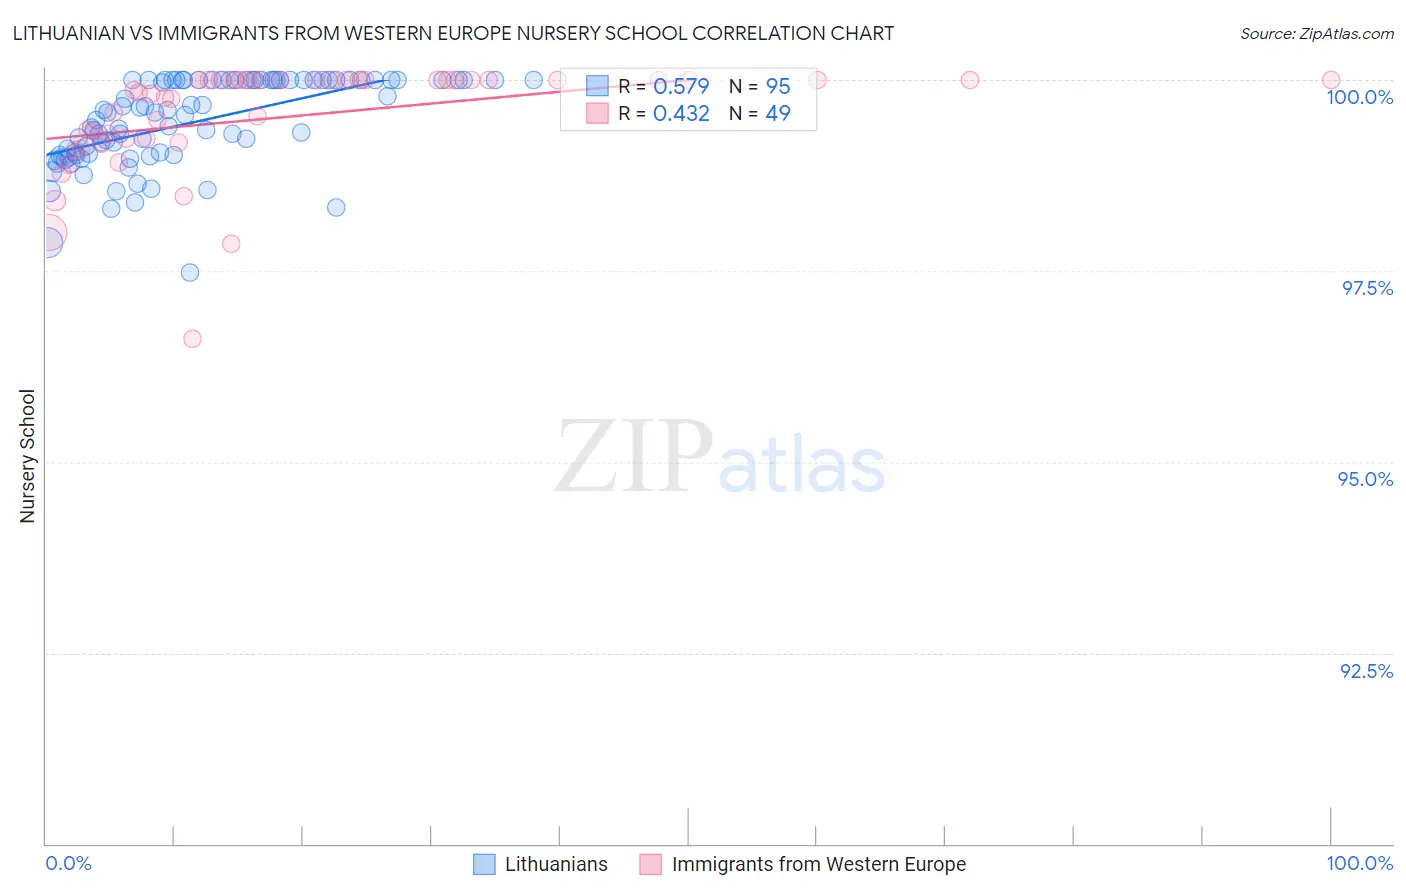
Lithuanian vs Immigrants from Western Europe Nursery School Correlation Chart
The statistical analysis conducted on geographies consisting of 421,946,231 people shows a substantial positive correlation between the proportion of Lithuanians and percentage of population with at least nursery school education in the United States with a correlation coefficient (R) of 0.579 and weighted average of 98.6%. Similarly, the statistical analysis conducted on geographies consisting of 494,080,297 people shows a moderate positive correlation between the proportion of Immigrants from Western Europe and percentage of population with at least nursery school education in the United States with a correlation coefficient (R) of 0.432 and weighted average of 98.3%, a difference of 0.33%.
Nursery School Correlation Summary
| Measurement | Lithuanian | Immigrants from Western Europe |
| Minimum | 97.5% | 96.6% |
| Maximum | 100.0% | 100.0% |
| Range | 2.5% | 3.4% |
| Mean | 99.4% | 99.5% |
| Median | 99.6% | 99.9% |
| Interquartile 25% (IQ1) | 99.0% | 99.2% |
| Interquartile 75% (IQ3) | 100.0% | 100.0% |
| Interquartile Range (IQR) | 0.98% | 0.79% |
| Standard Deviation (Sample) | 0.57% | 0.71% |
| Standard Deviation (Population) | 0.57% | 0.70% |
Similar Demographics by Nursery School
Demographics Similar to Lithuanians by Nursery School
In terms of nursery school, the demographic groups most similar to Lithuanians are Pennsylvania German (98.6%, a difference of 0.0%), Finnish (98.6%, a difference of 0.0%), Polish (98.6%, a difference of 0.0%), Danish (98.6%, a difference of 0.0%), and Scotch-Irish (98.6%, a difference of 0.0%).
| Demographics | Rating | Rank | Nursery School |
| Swedes | 100.0 /100 | #15 | Exceptional 98.7% |
| Scottish | 100.0 /100 | #16 | Exceptional 98.7% |
| Aleuts | 100.0 /100 | #17 | Exceptional 98.7% |
| Dutch | 100.0 /100 | #18 | Exceptional 98.7% |
| Irish | 100.0 /100 | #19 | Exceptional 98.6% |
| Pennsylvania Germans | 100.0 /100 | #20 | Exceptional 98.6% |
| Finns | 100.0 /100 | #21 | Exceptional 98.6% |
| Lithuanians | 100.0 /100 | #22 | Exceptional 98.6% |
| Poles | 100.0 /100 | #23 | Exceptional 98.6% |
| Danes | 100.0 /100 | #24 | Exceptional 98.6% |
| Scotch-Irish | 100.0 /100 | #25 | Exceptional 98.6% |
| Sioux | 100.0 /100 | #26 | Exceptional 98.6% |
| Arapaho | 100.0 /100 | #27 | Exceptional 98.6% |
| Croatians | 100.0 /100 | #28 | Exceptional 98.6% |
| French | 100.0 /100 | #29 | Exceptional 98.6% |
Demographics Similar to Immigrants from Western Europe by Nursery School
In terms of nursery school, the demographic groups most similar to Immigrants from Western Europe are Hopi (98.3%, a difference of 0.0%), Ukrainian (98.3%, a difference of 0.0%), Immigrants from South Africa (98.3%, a difference of 0.0%), Zimbabwean (98.3%, a difference of 0.0%), and Macedonian (98.3%, a difference of 0.0%).
| Demographics | Rating | Rank | Nursery School |
| Osage | 99.1 /100 | #83 | Exceptional 98.3% |
| Immigrants | Denmark | 99.1 /100 | #84 | Exceptional 98.3% |
| Immigrants | Sweden | 99.1 /100 | #85 | Exceptional 98.3% |
| Immigrants | Australia | 99.0 /100 | #86 | Exceptional 98.3% |
| Hopi | 98.9 /100 | #87 | Exceptional 98.3% |
| Ukrainians | 98.9 /100 | #88 | Exceptional 98.3% |
| Immigrants | South Africa | 98.8 /100 | #89 | Exceptional 98.3% |
| Immigrants | Western Europe | 98.8 /100 | #90 | Exceptional 98.3% |
| Zimbabweans | 98.8 /100 | #91 | Exceptional 98.3% |
| Macedonians | 98.7 /100 | #92 | Exceptional 98.3% |
| Immigrants | India | 98.7 /100 | #93 | Exceptional 98.3% |
| Immigrants | Germany | 98.6 /100 | #94 | Exceptional 98.3% |
| South Africans | 98.6 /100 | #95 | Exceptional 98.3% |
| Cypriots | 98.3 /100 | #96 | Exceptional 98.3% |
| Immigrants | Nonimmigrants | 98.3 /100 | #97 | Exceptional 98.3% |