Lithuanian vs Immigrants from Western Europe Disability Age 18 to 34
COMPARE
Lithuanian
Immigrants from Western Europe
Disability Age 18 to 34
Disability Age 18 to 34 Comparison
Lithuanians
Immigrants from Western Europe
7.0%
DISABILITY AGE 18 TO 34
4.1/ 100
METRIC RATING
229th/ 347
METRIC RANK
6.9%
DISABILITY AGE 18 TO 34
9.1/ 100
METRIC RATING
213th/ 347
METRIC RANK
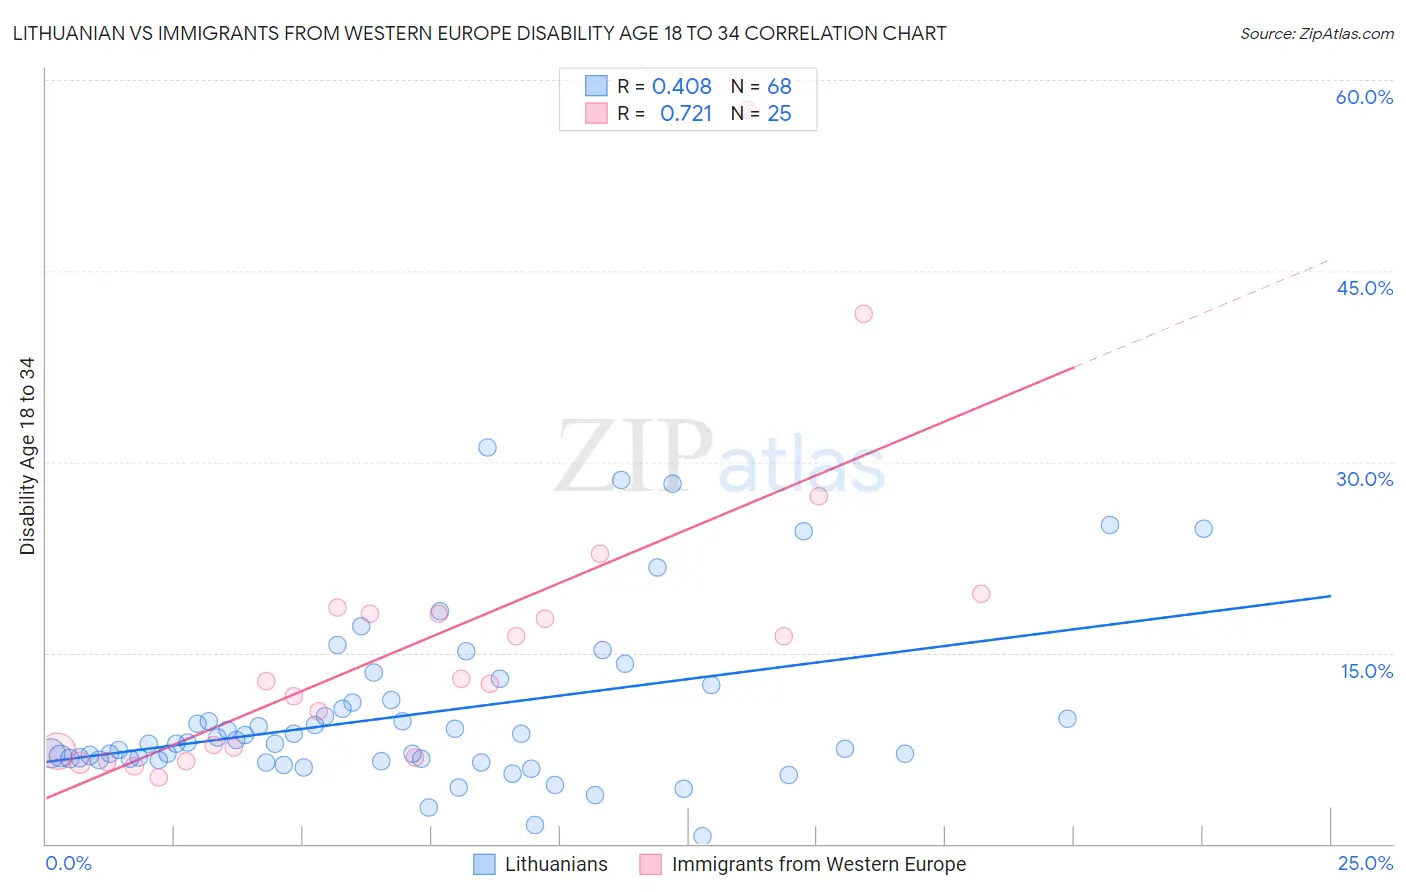
Lithuanian vs Immigrants from Western Europe Disability Age 18 to 34 Correlation Chart
The statistical analysis conducted on geographies consisting of 420,363,620 people shows a moderate positive correlation between the proportion of Lithuanians and percentage of population with a disability between the ages 18 and 35 in the United States with a correlation coefficient (R) of 0.408 and weighted average of 7.0%. Similarly, the statistical analysis conducted on geographies consisting of 491,827,703 people shows a strong positive correlation between the proportion of Immigrants from Western Europe and percentage of population with a disability between the ages 18 and 35 in the United States with a correlation coefficient (R) of 0.721 and weighted average of 6.9%, a difference of 1.4%.
Disability Age 18 to 34 Correlation Summary
| Measurement | Lithuanian | Immigrants from Western Europe |
| Minimum | 0.63% | 5.2% |
| Maximum | 31.1% | 57.7% |
| Range | 30.5% | 52.5% |
| Mean | 10.2% | 15.8% |
| Median | 7.9% | 12.8% |
| Interquartile 25% (IQ1) | 6.6% | 7.0% |
| Interquartile 75% (IQ3) | 11.2% | 18.3% |
| Interquartile Range (IQR) | 4.6% | 11.3% |
| Standard Deviation (Sample) | 6.5% | 12.0% |
| Standard Deviation (Population) | 6.4% | 11.8% |
Demographics Similar to Lithuanians and Immigrants from Western Europe by Disability Age 18 to 34
In terms of disability age 18 to 34, the demographic groups most similar to Lithuanians are Immigrants from Yemen (7.0%, a difference of 0.030%), Immigrants from Canada (7.0%, a difference of 0.080%), Immigrants from North America (7.0%, a difference of 0.090%), Ute (7.0%, a difference of 0.11%), and Ugandan (6.9%, a difference of 0.13%). Similarly, the demographic groups most similar to Immigrants from Western Europe are Luxembourger (6.9%, a difference of 0.070%), Immigrants from Norway (6.8%, a difference of 0.18%), Serbian (6.9%, a difference of 0.18%), Immigrants from Thailand (6.9%, a difference of 0.34%), and Sudanese (6.9%, a difference of 0.46%).
| Demographics | Rating | Rank | Disability Age 18 to 34 |
| Immigrants | Norway | 10.0 /100 | #211 | Tragic 6.8% |
| Luxembourgers | 9.4 /100 | #212 | Tragic 6.9% |
| Immigrants | Western Europe | 9.1 /100 | #213 | Tragic 6.9% |
| Serbians | 8.2 /100 | #214 | Tragic 6.9% |
| Immigrants | Thailand | 7.5 /100 | #215 | Tragic 6.9% |
| Sudanese | 7.0 /100 | #216 | Tragic 6.9% |
| Immigrants | Kenya | 6.9 /100 | #217 | Tragic 6.9% |
| Ukrainians | 6.7 /100 | #218 | Tragic 6.9% |
| Hawaiians | 6.5 /100 | #219 | Tragic 6.9% |
| Immigrants | Senegal | 5.5 /100 | #220 | Tragic 6.9% |
| Immigrants | Middle Africa | 5.5 /100 | #221 | Tragic 6.9% |
| Immigrants | England | 5.3 /100 | #222 | Tragic 6.9% |
| Carpatho Rusyns | 5.2 /100 | #223 | Tragic 6.9% |
| Senegalese | 4.9 /100 | #224 | Tragic 6.9% |
| Central American Indians | 4.7 /100 | #225 | Tragic 6.9% |
| Ugandans | 4.4 /100 | #226 | Tragic 6.9% |
| Immigrants | Canada | 4.3 /100 | #227 | Tragic 7.0% |
| Immigrants | Yemen | 4.2 /100 | #228 | Tragic 7.0% |
| Lithuanians | 4.1 /100 | #229 | Tragic 7.0% |
| Immigrants | North America | 3.9 /100 | #230 | Tragic 7.0% |
| Ute | 3.8 /100 | #231 | Tragic 7.0% |