Liberian vs Immigrants from Russia 10th Grade
COMPARE
Liberian
Immigrants from Russia
10th Grade
10th Grade Comparison
Liberians
Immigrants from Russia
93.6%
10TH GRADE
34.7/ 100
METRIC RATING
187th/ 347
METRIC RANK
94.3%
10TH GRADE
92.4/ 100
METRIC RATING
132nd/ 347
METRIC RANK
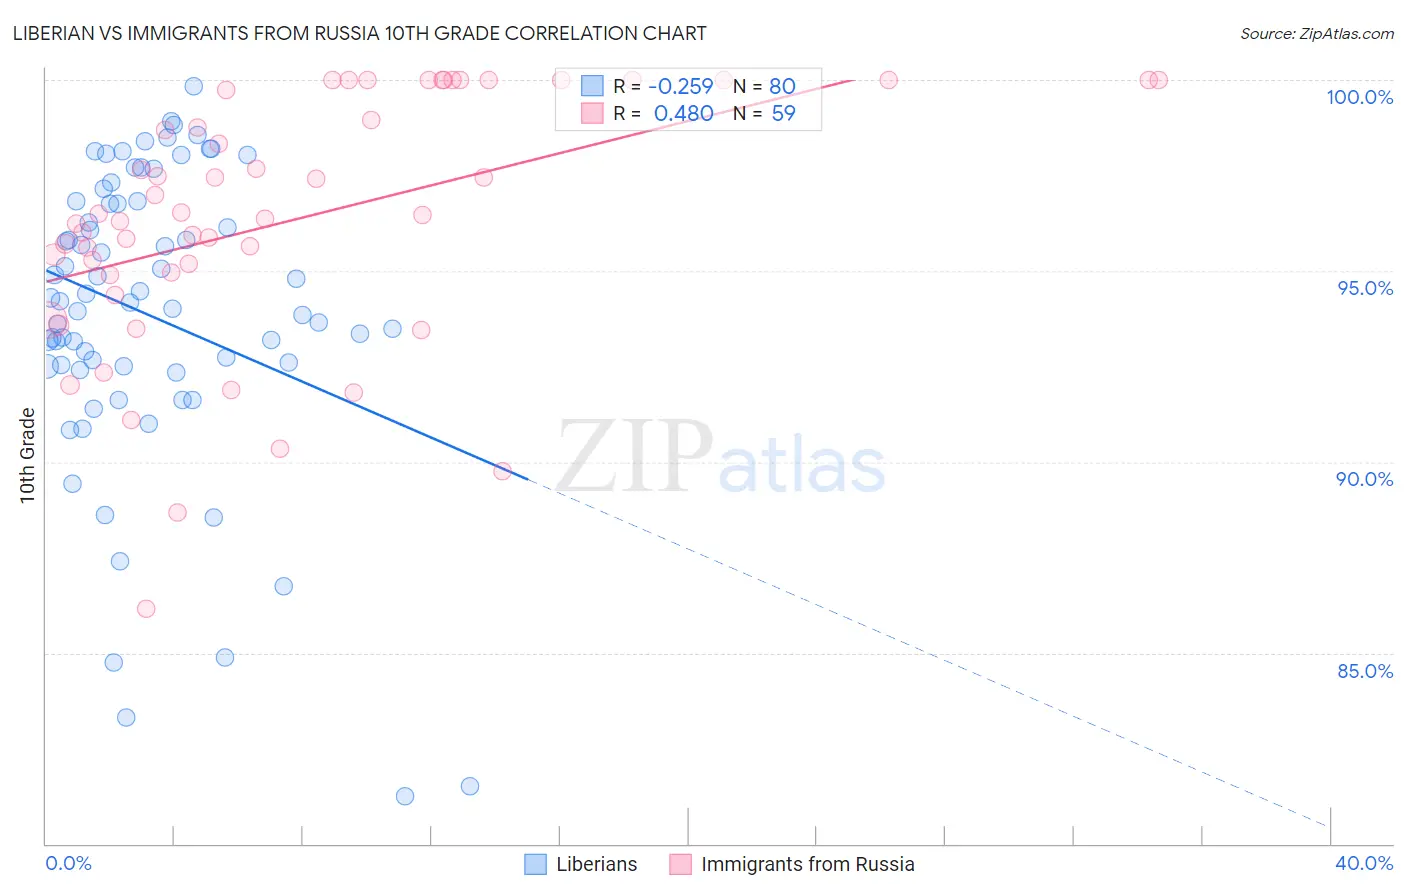
Liberian vs Immigrants from Russia 10th Grade Correlation Chart
The statistical analysis conducted on geographies consisting of 118,103,458 people shows a weak negative correlation between the proportion of Liberians and percentage of population with at least 10th grade education in the United States with a correlation coefficient (R) of -0.259 and weighted average of 93.6%. Similarly, the statistical analysis conducted on geographies consisting of 347,948,494 people shows a moderate positive correlation between the proportion of Immigrants from Russia and percentage of population with at least 10th grade education in the United States with a correlation coefficient (R) of 0.480 and weighted average of 94.3%, a difference of 0.70%.
10th Grade Correlation Summary
| Measurement | Liberian | Immigrants from Russia |
| Minimum | 81.2% | 86.2% |
| Maximum | 99.8% | 100.0% |
| Range | 18.6% | 13.8% |
| Mean | 93.8% | 96.3% |
| Median | 94.2% | 96.5% |
| Interquartile 25% (IQ1) | 92.5% | 94.9% |
| Interquartile 75% (IQ3) | 96.8% | 100.0% |
| Interquartile Range (IQR) | 4.3% | 5.1% |
| Standard Deviation (Sample) | 4.0% | 3.3% |
| Standard Deviation (Population) | 3.9% | 3.3% |
Similar Demographics by 10th Grade
Demographics Similar to Liberians by 10th Grade
In terms of 10th grade, the demographic groups most similar to Liberians are Immigrants from Eastern Asia (93.6%, a difference of 0.0%), Guamanian/Chamorro (93.6%, a difference of 0.020%), Choctaw (93.6%, a difference of 0.020%), Sudanese (93.6%, a difference of 0.020%), and Marshallese (93.6%, a difference of 0.020%).
| Demographics | Rating | Rank | 10th Grade |
| Blackfeet | 42.8 /100 | #180 | Average 93.7% |
| Immigrants | Northern Africa | 41.6 /100 | #181 | Average 93.7% |
| Colville | 38.8 /100 | #182 | Fair 93.6% |
| Guamanians/Chamorros | 37.1 /100 | #183 | Fair 93.6% |
| Choctaw | 36.6 /100 | #184 | Fair 93.6% |
| Sudanese | 36.6 /100 | #185 | Fair 93.6% |
| Immigrants | Eastern Asia | 35.1 /100 | #186 | Fair 93.6% |
| Liberians | 34.7 /100 | #187 | Fair 93.6% |
| Marshallese | 33.2 /100 | #188 | Fair 93.6% |
| Immigrants | Pakistan | 32.5 /100 | #189 | Fair 93.6% |
| Laotians | 32.1 /100 | #190 | Fair 93.6% |
| Yup'ik | 31.1 /100 | #191 | Fair 93.6% |
| Immigrants | Malaysia | 28.0 /100 | #192 | Fair 93.5% |
| Panamanians | 28.0 /100 | #193 | Fair 93.5% |
| Immigrants | Morocco | 26.9 /100 | #194 | Fair 93.5% |
Demographics Similar to Immigrants from Russia by 10th Grade
In terms of 10th grade, the demographic groups most similar to Immigrants from Russia are Iroquois (94.3%, a difference of 0.010%), Immigrants from Greece (94.3%, a difference of 0.010%), Immigrants from Eastern Europe (94.3%, a difference of 0.010%), Creek (94.2%, a difference of 0.010%), and Osage (94.2%, a difference of 0.020%).
| Demographics | Rating | Rank | 10th Grade |
| Americans | 94.4 /100 | #125 | Exceptional 94.3% |
| Immigrants | Iran | 94.4 /100 | #126 | Exceptional 94.3% |
| Israelis | 93.8 /100 | #127 | Exceptional 94.3% |
| Potawatomi | 93.6 /100 | #128 | Exceptional 94.3% |
| Iroquois | 92.8 /100 | #129 | Exceptional 94.3% |
| Immigrants | Greece | 92.7 /100 | #130 | Exceptional 94.3% |
| Immigrants | Eastern Europe | 92.5 /100 | #131 | Exceptional 94.3% |
| Immigrants | Russia | 92.4 /100 | #132 | Exceptional 94.3% |
| Creek | 91.9 /100 | #133 | Exceptional 94.2% |
| Osage | 91.7 /100 | #134 | Exceptional 94.2% |
| Immigrants | Korea | 91.3 /100 | #135 | Exceptional 94.2% |
| Shoshone | 90.8 /100 | #136 | Exceptional 94.2% |
| Arapaho | 90.5 /100 | #137 | Exceptional 94.2% |
| Immigrants | Sri Lanka | 89.9 /100 | #138 | Excellent 94.2% |
| Immigrants | Bosnia and Herzegovina | 89.4 /100 | #139 | Excellent 94.2% |