Liberian vs Ecuadorian 10th Grade
COMPARE
Liberian
Ecuadorian
10th Grade
10th Grade Comparison
Liberians
Ecuadorians
93.6%
10TH GRADE
34.7/ 100
METRIC RATING
187th/ 347
METRIC RANK
90.6%
10TH GRADE
0.0/ 100
METRIC RATING
316th/ 347
METRIC RANK
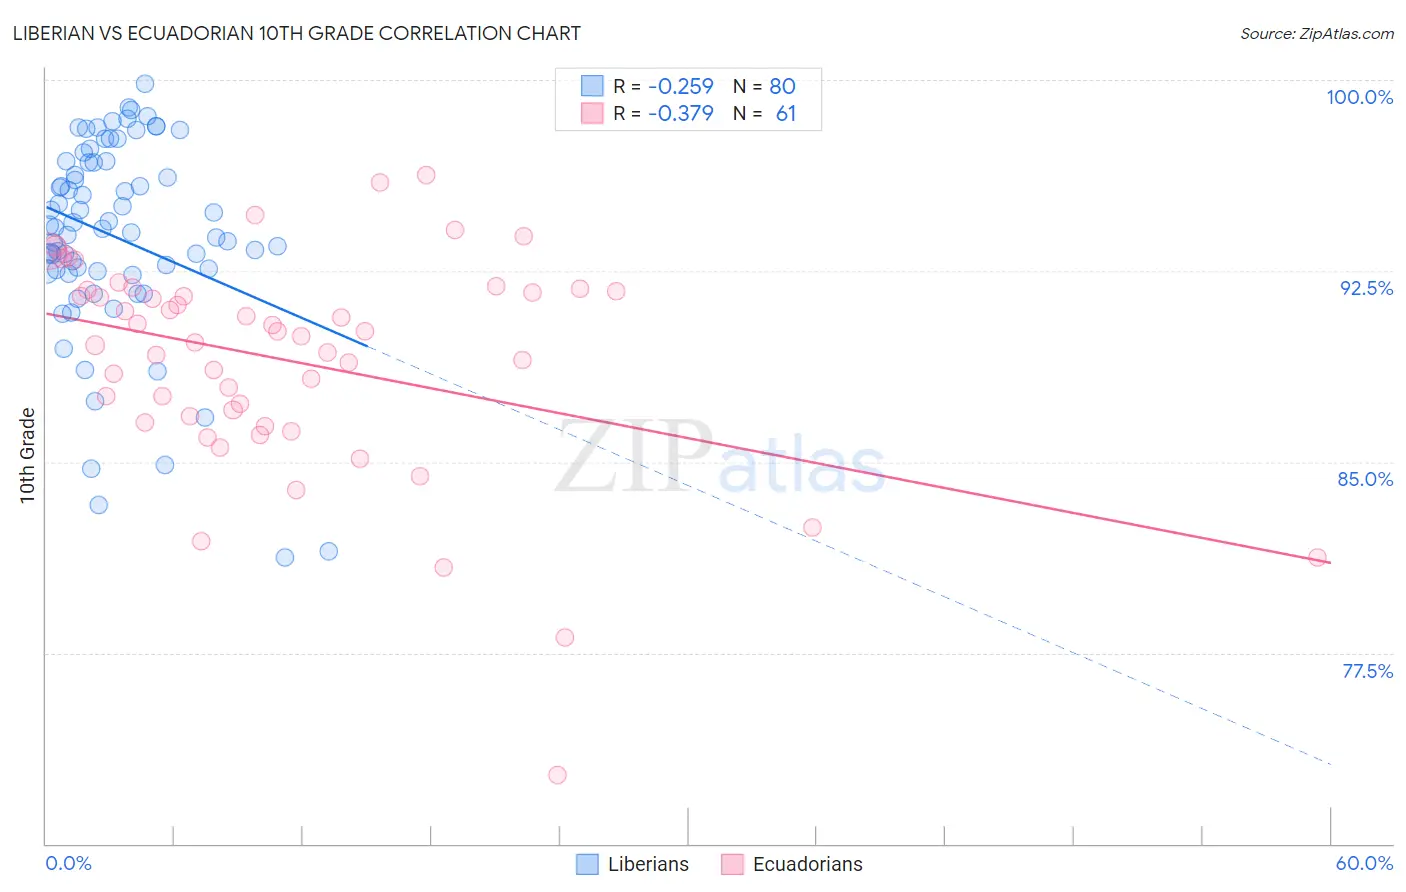
Liberian vs Ecuadorian 10th Grade Correlation Chart
The statistical analysis conducted on geographies consisting of 118,103,458 people shows a weak negative correlation between the proportion of Liberians and percentage of population with at least 10th grade education in the United States with a correlation coefficient (R) of -0.259 and weighted average of 93.6%. Similarly, the statistical analysis conducted on geographies consisting of 317,864,750 people shows a mild negative correlation between the proportion of Ecuadorians and percentage of population with at least 10th grade education in the United States with a correlation coefficient (R) of -0.379 and weighted average of 90.6%, a difference of 3.3%.
10th Grade Correlation Summary
| Measurement | Liberian | Ecuadorian |
| Minimum | 81.2% | 72.7% |
| Maximum | 99.8% | 96.2% |
| Range | 18.6% | 23.5% |
| Mean | 93.8% | 89.0% |
| Median | 94.2% | 89.9% |
| Interquartile 25% (IQ1) | 92.5% | 86.7% |
| Interquartile 75% (IQ3) | 96.8% | 91.7% |
| Interquartile Range (IQR) | 4.3% | 5.1% |
| Standard Deviation (Sample) | 4.0% | 4.3% |
| Standard Deviation (Population) | 3.9% | 4.3% |
Similar Demographics by 10th Grade
Demographics Similar to Liberians by 10th Grade
In terms of 10th grade, the demographic groups most similar to Liberians are Immigrants from Eastern Asia (93.6%, a difference of 0.0%), Guamanian/Chamorro (93.6%, a difference of 0.020%), Choctaw (93.6%, a difference of 0.020%), Sudanese (93.6%, a difference of 0.020%), and Marshallese (93.6%, a difference of 0.020%).
| Demographics | Rating | Rank | 10th Grade |
| Blackfeet | 42.8 /100 | #180 | Average 93.7% |
| Immigrants | Northern Africa | 41.6 /100 | #181 | Average 93.7% |
| Colville | 38.8 /100 | #182 | Fair 93.6% |
| Guamanians/Chamorros | 37.1 /100 | #183 | Fair 93.6% |
| Choctaw | 36.6 /100 | #184 | Fair 93.6% |
| Sudanese | 36.6 /100 | #185 | Fair 93.6% |
| Immigrants | Eastern Asia | 35.1 /100 | #186 | Fair 93.6% |
| Liberians | 34.7 /100 | #187 | Fair 93.6% |
| Marshallese | 33.2 /100 | #188 | Fair 93.6% |
| Immigrants | Pakistan | 32.5 /100 | #189 | Fair 93.6% |
| Laotians | 32.1 /100 | #190 | Fair 93.6% |
| Yup'ik | 31.1 /100 | #191 | Fair 93.6% |
| Immigrants | Malaysia | 28.0 /100 | #192 | Fair 93.5% |
| Panamanians | 28.0 /100 | #193 | Fair 93.5% |
| Immigrants | Morocco | 26.9 /100 | #194 | Fair 93.5% |
Demographics Similar to Ecuadorians by 10th Grade
In terms of 10th grade, the demographic groups most similar to Ecuadorians are Immigrants from Caribbean (90.6%, a difference of 0.010%), Nepalese (90.7%, a difference of 0.090%), Cape Verdean (90.8%, a difference of 0.17%), Immigrants from Ecuador (90.4%, a difference of 0.17%), and Immigrants from Portugal (90.8%, a difference of 0.20%).
| Demographics | Rating | Rank | 10th Grade |
| Immigrants | Immigrants | 0.0 /100 | #309 | Tragic 91.0% |
| Vietnamese | 0.0 /100 | #310 | Tragic 90.9% |
| Immigrants | Cambodia | 0.0 /100 | #311 | Tragic 90.9% |
| Immigrants | Portugal | 0.0 /100 | #312 | Tragic 90.8% |
| Cape Verdeans | 0.0 /100 | #313 | Tragic 90.8% |
| Nepalese | 0.0 /100 | #314 | Tragic 90.7% |
| Immigrants | Caribbean | 0.0 /100 | #315 | Tragic 90.6% |
| Ecuadorians | 0.0 /100 | #316 | Tragic 90.6% |
| Immigrants | Ecuador | 0.0 /100 | #317 | Tragic 90.4% |
| Immigrants | Cuba | 0.0 /100 | #318 | Tragic 90.2% |
| Nicaraguans | 0.0 /100 | #319 | Tragic 90.2% |
| Houma | 0.0 /100 | #320 | Tragic 90.2% |
| Belizeans | 0.0 /100 | #321 | Tragic 90.2% |
| Tohono O'odham | 0.0 /100 | #322 | Tragic 90.1% |
| Immigrants | Belize | 0.0 /100 | #323 | Tragic 90.1% |