Okinawan vs Immigrants from Philippines 6th Grade
COMPARE
Okinawan
Immigrants from Philippines
6th Grade
6th Grade Comparison
Okinawans
Immigrants from Philippines
97.4%
6TH GRADE
94.2/ 100
METRIC RATING
124th/ 347
METRIC RANK
96.3%
6TH GRADE
0.1/ 100
METRIC RATING
274th/ 347
METRIC RANK
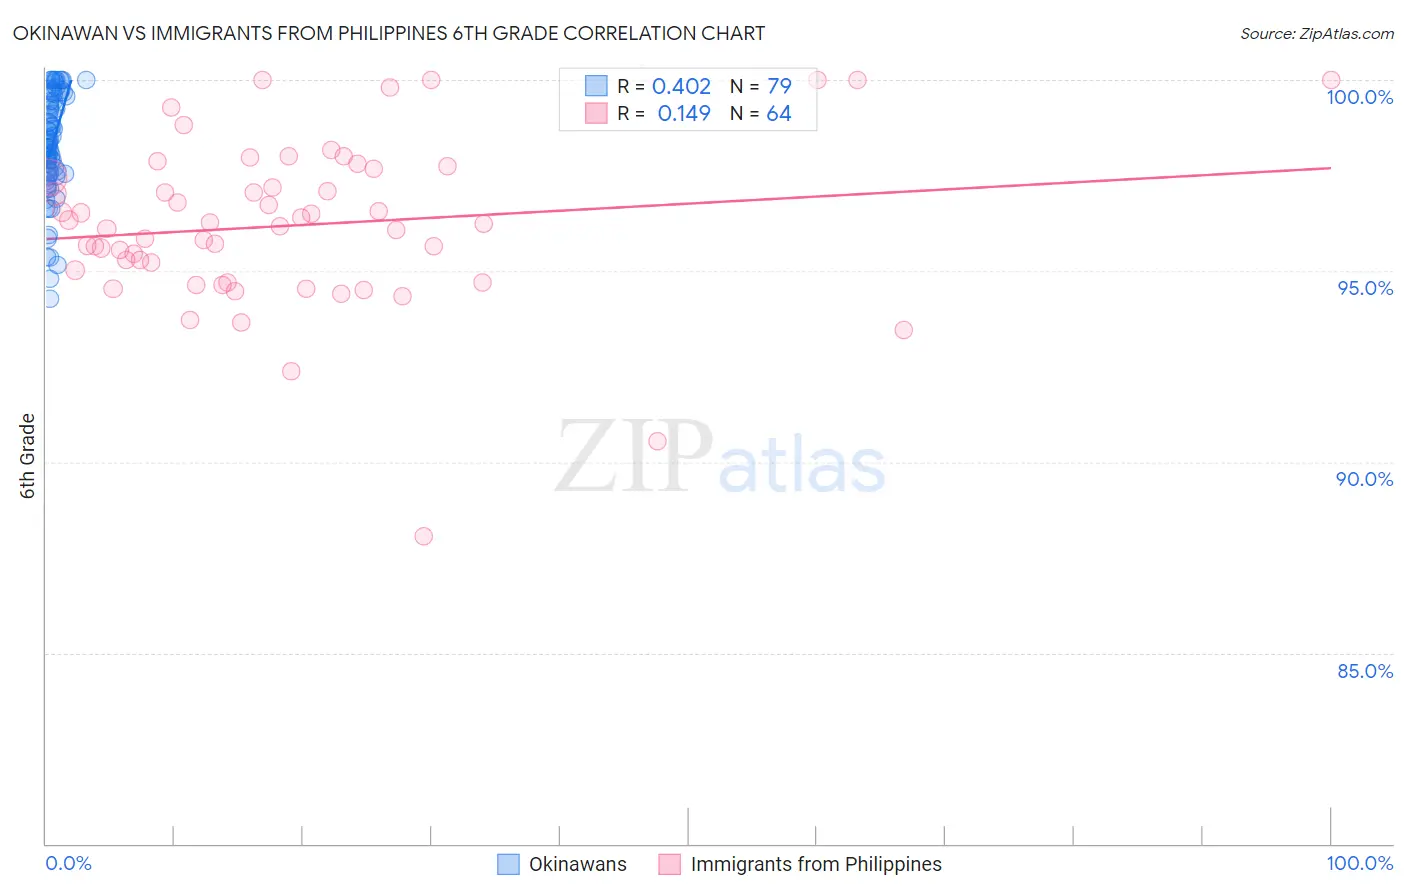
Okinawan vs Immigrants from Philippines 6th Grade Correlation Chart
The statistical analysis conducted on geographies consisting of 73,779,368 people shows a moderate positive correlation between the proportion of Okinawans and percentage of population with at least 6th grade education in the United States with a correlation coefficient (R) of 0.402 and weighted average of 97.4%. Similarly, the statistical analysis conducted on geographies consisting of 471,303,531 people shows a poor positive correlation between the proportion of Immigrants from Philippines and percentage of population with at least 6th grade education in the United States with a correlation coefficient (R) of 0.149 and weighted average of 96.3%, a difference of 1.1%.
6th Grade Correlation Summary
| Measurement | Okinawan | Immigrants from Philippines |
| Minimum | 94.3% | 88.1% |
| Maximum | 100.0% | 100.0% |
| Range | 5.7% | 11.9% |
| Mean | 98.3% | 96.2% |
| Median | 98.3% | 96.2% |
| Interquartile 25% (IQ1) | 97.5% | 94.9% |
| Interquartile 75% (IQ3) | 99.4% | 97.6% |
| Interquartile Range (IQR) | 2.0% | 2.7% |
| Standard Deviation (Sample) | 1.4% | 2.2% |
| Standard Deviation (Population) | 1.4% | 2.2% |
Similar Demographics by 6th Grade
Demographics Similar to Okinawans by 6th Grade
In terms of 6th grade, the demographic groups most similar to Okinawans are Hmong (97.4%, a difference of 0.0%), Syrian (97.4%, a difference of 0.010%), Immigrants from Norway (97.4%, a difference of 0.010%), Immigrants from France (97.4%, a difference of 0.010%), and Spanish (97.3%, a difference of 0.010%).
| Demographics | Rating | Rank | 6th Grade |
| Basques | 95.4 /100 | #117 | Exceptional 97.4% |
| Immigrants | Japan | 95.2 /100 | #118 | Exceptional 97.4% |
| Immigrants | Zimbabwe | 95.0 /100 | #119 | Exceptional 97.4% |
| Syrians | 94.8 /100 | #120 | Exceptional 97.4% |
| Immigrants | Norway | 94.7 /100 | #121 | Exceptional 97.4% |
| Immigrants | France | 94.5 /100 | #122 | Exceptional 97.4% |
| Hmong | 94.4 /100 | #123 | Exceptional 97.4% |
| Okinawans | 94.2 /100 | #124 | Exceptional 97.4% |
| Spanish | 93.7 /100 | #125 | Exceptional 97.3% |
| Immigrants | Bulgaria | 93.6 /100 | #126 | Exceptional 97.3% |
| Immigrants | Croatia | 93.1 /100 | #127 | Exceptional 97.3% |
| Immigrants | Romania | 92.0 /100 | #128 | Exceptional 97.3% |
| Immigrants | Serbia | 91.9 /100 | #129 | Exceptional 97.3% |
| Cambodians | 91.8 /100 | #130 | Exceptional 97.3% |
| Immigrants | Europe | 91.1 /100 | #131 | Exceptional 97.3% |
Demographics Similar to Immigrants from Philippines by 6th Grade
In terms of 6th grade, the demographic groups most similar to Immigrants from Philippines are Immigrants from Cameroon (96.3%, a difference of 0.0%), Immigrants from Bolivia (96.3%, a difference of 0.010%), Immigrants from Ghana (96.3%, a difference of 0.010%), Yaqui (96.3%, a difference of 0.020%), and Immigrants from Western Africa (96.3%, a difference of 0.030%).
| Demographics | Rating | Rank | 6th Grade |
| Afghans | 0.2 /100 | #267 | Tragic 96.4% |
| Immigrants | Uzbekistan | 0.2 /100 | #268 | Tragic 96.3% |
| West Indians | 0.2 /100 | #269 | Tragic 96.3% |
| Immigrants | South America | 0.2 /100 | #270 | Tragic 96.3% |
| Immigrants | Hong Kong | 0.2 /100 | #271 | Tragic 96.3% |
| Immigrants | Bolivia | 0.1 /100 | #272 | Tragic 96.3% |
| Immigrants | Cameroon | 0.1 /100 | #273 | Tragic 96.3% |
| Immigrants | Philippines | 0.1 /100 | #274 | Tragic 96.3% |
| Immigrants | Ghana | 0.1 /100 | #275 | Tragic 96.3% |
| Yaqui | 0.1 /100 | #276 | Tragic 96.3% |
| Immigrants | Western Africa | 0.1 /100 | #277 | Tragic 96.3% |
| Immigrants | Thailand | 0.1 /100 | #278 | Tragic 96.3% |
| Immigrants | Peru | 0.1 /100 | #279 | Tragic 96.2% |
| Immigrants | Afghanistan | 0.1 /100 | #280 | Tragic 96.2% |
| Trinidadians and Tobagonians | 0.1 /100 | #281 | Tragic 96.2% |