Kenyan vs Immigrants from Senegal 4th Grade
COMPARE
Kenyan
Immigrants from Senegal
4th Grade
4th Grade Comparison
Kenyans
Immigrants from Senegal
97.5%
4TH GRADE
56.5/ 100
METRIC RATING
166th/ 347
METRIC RANK
97.1%
4TH GRADE
0.9/ 100
METRIC RATING
250th/ 347
METRIC RANK
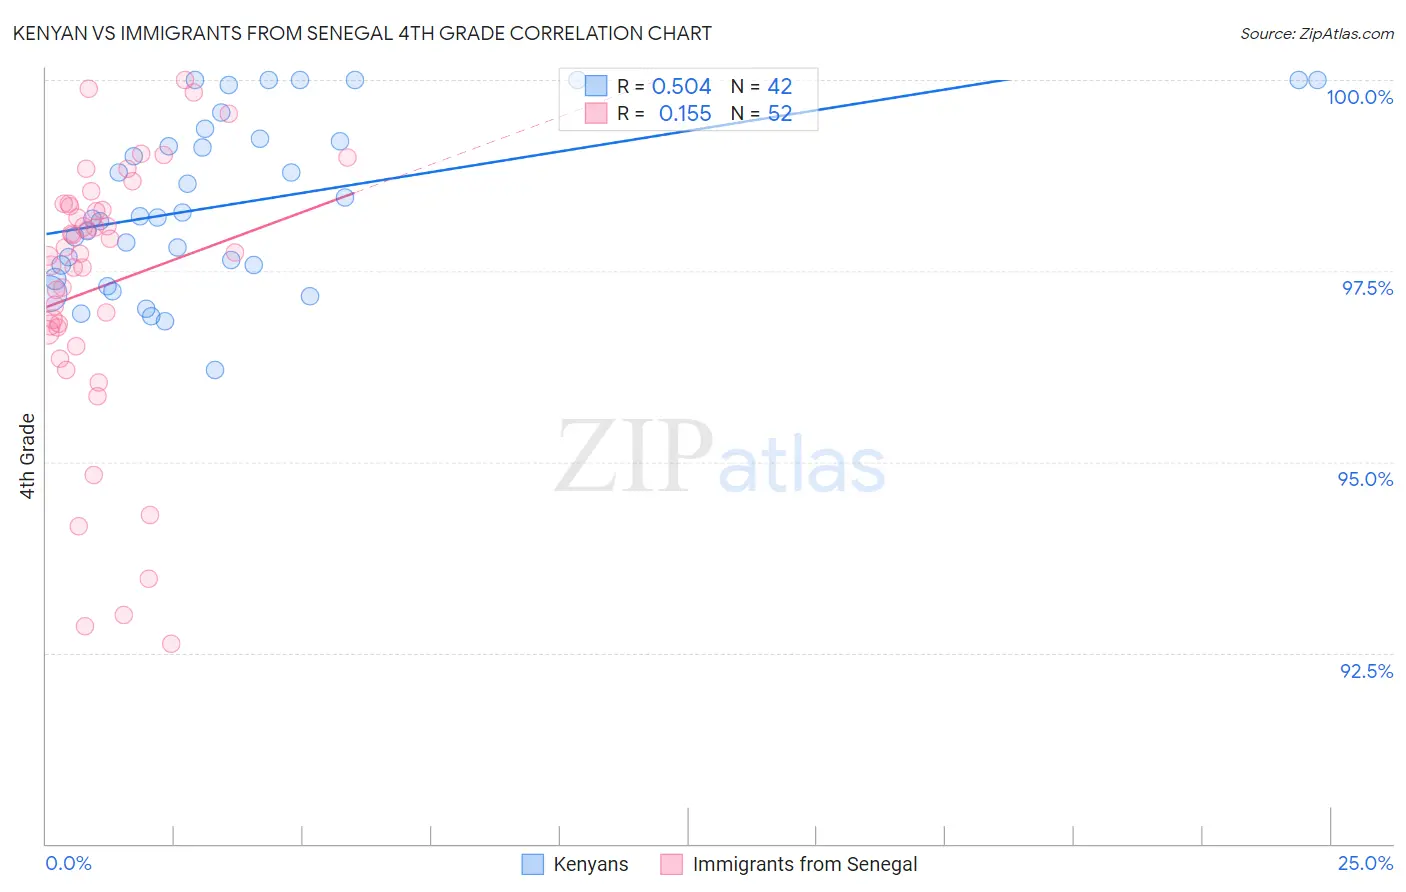
Kenyan vs Immigrants from Senegal 4th Grade Correlation Chart
The statistical analysis conducted on geographies consisting of 168,244,481 people shows a substantial positive correlation between the proportion of Kenyans and percentage of population with at least 4th grade education in the United States with a correlation coefficient (R) of 0.504 and weighted average of 97.5%. Similarly, the statistical analysis conducted on geographies consisting of 90,130,297 people shows a poor positive correlation between the proportion of Immigrants from Senegal and percentage of population with at least 4th grade education in the United States with a correlation coefficient (R) of 0.155 and weighted average of 97.1%, a difference of 0.47%.
4th Grade Correlation Summary
| Measurement | Kenyan | Immigrants from Senegal |
| Minimum | 96.2% | 92.6% |
| Maximum | 100.0% | 100.0% |
| Range | 3.8% | 7.4% |
| Mean | 98.4% | 97.3% |
| Median | 98.2% | 97.7% |
| Interquartile 25% (IQ1) | 97.6% | 96.7% |
| Interquartile 75% (IQ3) | 99.2% | 98.4% |
| Interquartile Range (IQR) | 1.6% | 1.6% |
| Standard Deviation (Sample) | 1.1% | 1.8% |
| Standard Deviation (Population) | 1.1% | 1.8% |
Similar Demographics by 4th Grade
Demographics Similar to Kenyans by 4th Grade
In terms of 4th grade, the demographic groups most similar to Kenyans are Immigrants from Poland (97.5%, a difference of 0.0%), Immigrants from Belarus (97.5%, a difference of 0.0%), Immigrants from Iran (97.6%, a difference of 0.010%), Ugandan (97.6%, a difference of 0.010%), and Venezuelan (97.6%, a difference of 0.010%).
| Demographics | Rating | Rank | 4th Grade |
| Immigrants | Italy | 63.7 /100 | #159 | Good 97.6% |
| Apache | 61.3 /100 | #160 | Good 97.6% |
| Marshallese | 60.8 /100 | #161 | Good 97.6% |
| Bermudans | 60.5 /100 | #162 | Good 97.6% |
| Immigrants | Iran | 60.3 /100 | #163 | Good 97.6% |
| Ugandans | 58.9 /100 | #164 | Average 97.6% |
| Venezuelans | 58.7 /100 | #165 | Average 97.6% |
| Kenyans | 56.5 /100 | #166 | Average 97.5% |
| Immigrants | Poland | 55.9 /100 | #167 | Average 97.5% |
| Immigrants | Belarus | 55.8 /100 | #168 | Average 97.5% |
| Chileans | 54.4 /100 | #169 | Average 97.5% |
| Immigrants | Spain | 51.8 /100 | #170 | Average 97.5% |
| Brazilians | 51.5 /100 | #171 | Average 97.5% |
| Immigrants | Sri Lanka | 51.1 /100 | #172 | Average 97.5% |
| Immigrants | Korea | 50.6 /100 | #173 | Average 97.5% |
Demographics Similar to Immigrants from Senegal by 4th Grade
In terms of 4th grade, the demographic groups most similar to Immigrants from Senegal are Immigrants from Africa (97.1%, a difference of 0.0%), South American (97.1%, a difference of 0.010%), Jamaican (97.1%, a difference of 0.010%), Immigrants from Liberia (97.1%, a difference of 0.010%), and Immigrants from Middle Africa (97.1%, a difference of 0.010%).
| Demographics | Rating | Rank | 4th Grade |
| U.S. Virgin Islanders | 1.4 /100 | #243 | Tragic 97.1% |
| Koreans | 1.3 /100 | #244 | Tragic 97.1% |
| Immigrants | Eastern Africa | 1.2 /100 | #245 | Tragic 97.1% |
| Immigrants | Uruguay | 1.2 /100 | #246 | Tragic 97.1% |
| Ethiopians | 1.2 /100 | #247 | Tragic 97.1% |
| Immigrants | Asia | 1.2 /100 | #248 | Tragic 97.1% |
| Immigrants | Africa | 1.0 /100 | #249 | Tragic 97.1% |
| Immigrants | Senegal | 0.9 /100 | #250 | Tragic 97.1% |
| South Americans | 0.8 /100 | #251 | Tragic 97.1% |
| Jamaicans | 0.8 /100 | #252 | Tragic 97.1% |
| Immigrants | Liberia | 0.8 /100 | #253 | Tragic 97.1% |
| Immigrants | Middle Africa | 0.8 /100 | #254 | Tragic 97.1% |
| Peruvians | 0.7 /100 | #255 | Tragic 97.1% |
| Bolivians | 0.7 /100 | #256 | Tragic 97.1% |
| Immigrants | Congo | 0.5 /100 | #257 | Tragic 97.0% |