Pima vs Immigrants from Senegal 4th Grade
COMPARE
Pima
Immigrants from Senegal
4th Grade
4th Grade Comparison
Pima
Immigrants from Senegal
97.7%
4TH GRADE
92.0/ 100
METRIC RATING
128th/ 347
METRIC RANK
97.1%
4TH GRADE
0.9/ 100
METRIC RATING
250th/ 347
METRIC RANK
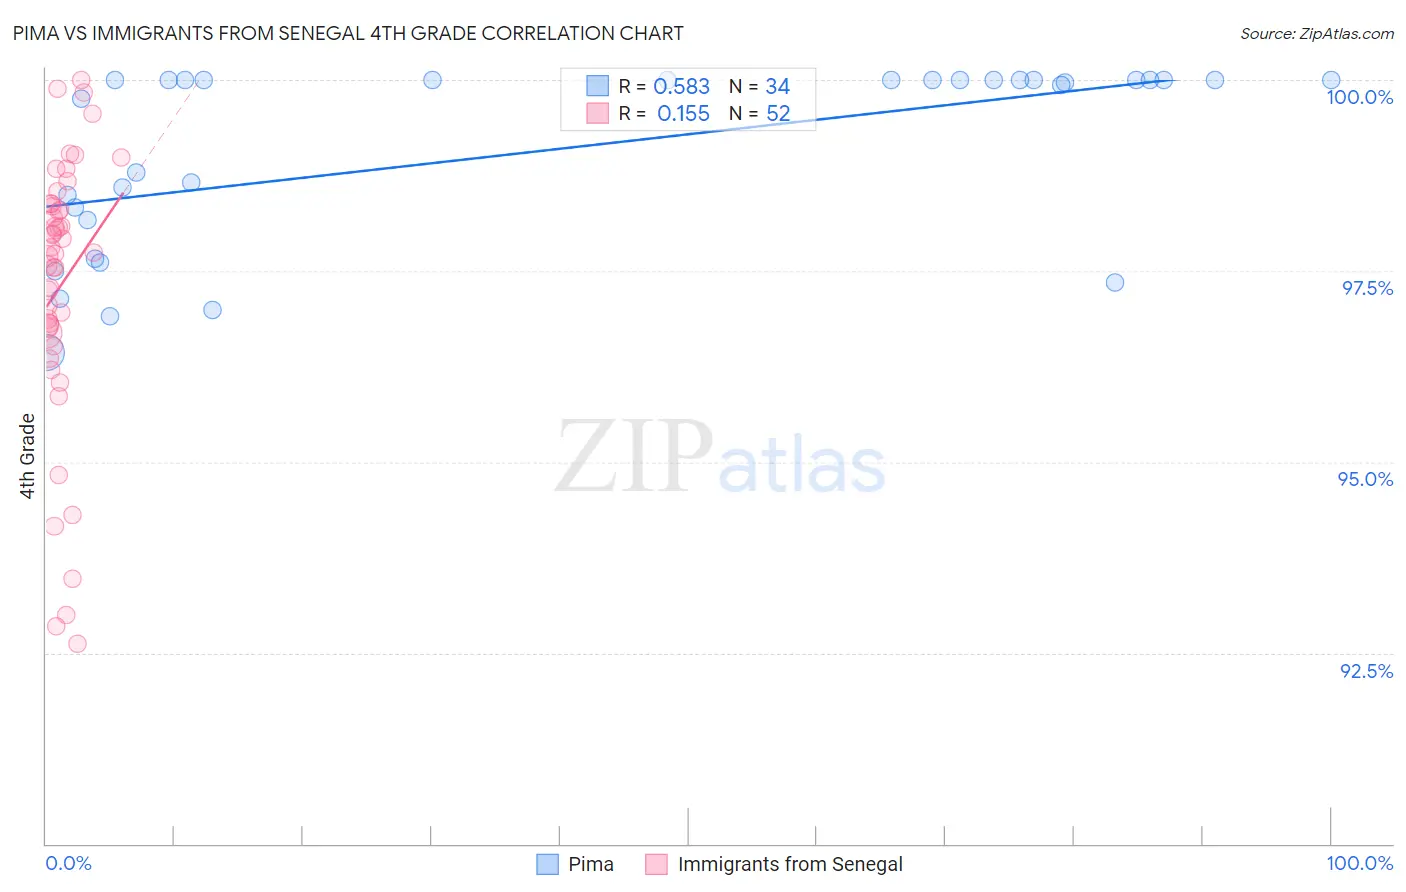
Pima vs Immigrants from Senegal 4th Grade Correlation Chart
The statistical analysis conducted on geographies consisting of 61,552,942 people shows a substantial positive correlation between the proportion of Pima and percentage of population with at least 4th grade education in the United States with a correlation coefficient (R) of 0.583 and weighted average of 97.7%. Similarly, the statistical analysis conducted on geographies consisting of 90,130,297 people shows a poor positive correlation between the proportion of Immigrants from Senegal and percentage of population with at least 4th grade education in the United States with a correlation coefficient (R) of 0.155 and weighted average of 97.1%, a difference of 0.68%.
4th Grade Correlation Summary
| Measurement | Pima | Immigrants from Senegal |
| Minimum | 96.4% | 92.6% |
| Maximum | 100.0% | 100.0% |
| Range | 3.6% | 7.4% |
| Mean | 99.1% | 97.3% |
| Median | 100.0% | 97.7% |
| Interquartile 25% (IQ1) | 98.2% | 96.7% |
| Interquartile 75% (IQ3) | 100.0% | 98.4% |
| Interquartile Range (IQR) | 1.8% | 1.6% |
| Standard Deviation (Sample) | 1.2% | 1.8% |
| Standard Deviation (Population) | 1.2% | 1.8% |
Similar Demographics by 4th Grade
Demographics Similar to Pima by 4th Grade
In terms of 4th grade, the demographic groups most similar to Pima are Colville (97.7%, a difference of 0.0%), Immigrants from Serbia (97.8%, a difference of 0.010%), Immigrants from Europe (97.8%, a difference of 0.010%), Immigrants from Bulgaria (97.7%, a difference of 0.010%), and Spanish (97.8%, a difference of 0.020%).
| Demographics | Rating | Rank | 4th Grade |
| Immigrants | Norway | 94.2 /100 | #121 | Exceptional 97.8% |
| Immigrants | Japan | 94.1 /100 | #122 | Exceptional 97.8% |
| Immigrants | Zimbabwe | 93.9 /100 | #123 | Exceptional 97.8% |
| Spanish | 93.7 /100 | #124 | Exceptional 97.8% |
| Immigrants | Serbia | 92.6 /100 | #125 | Exceptional 97.8% |
| Immigrants | Europe | 92.5 /100 | #126 | Exceptional 97.8% |
| Colville | 92.3 /100 | #127 | Exceptional 97.7% |
| Pima | 92.0 /100 | #128 | Exceptional 97.7% |
| Immigrants | Bulgaria | 91.3 /100 | #129 | Exceptional 97.7% |
| Immigrants | Romania | 90.6 /100 | #130 | Exceptional 97.7% |
| Immigrants | Kuwait | 89.7 /100 | #131 | Excellent 97.7% |
| Immigrants | Hungary | 89.3 /100 | #132 | Excellent 97.7% |
| Hmong | 88.2 /100 | #133 | Excellent 97.7% |
| Palestinians | 88.1 /100 | #134 | Excellent 97.7% |
| Cambodians | 87.8 /100 | #135 | Excellent 97.7% |
Demographics Similar to Immigrants from Senegal by 4th Grade
In terms of 4th grade, the demographic groups most similar to Immigrants from Senegal are Immigrants from Africa (97.1%, a difference of 0.0%), South American (97.1%, a difference of 0.010%), Jamaican (97.1%, a difference of 0.010%), Immigrants from Liberia (97.1%, a difference of 0.010%), and Immigrants from Middle Africa (97.1%, a difference of 0.010%).
| Demographics | Rating | Rank | 4th Grade |
| U.S. Virgin Islanders | 1.4 /100 | #243 | Tragic 97.1% |
| Koreans | 1.3 /100 | #244 | Tragic 97.1% |
| Immigrants | Eastern Africa | 1.2 /100 | #245 | Tragic 97.1% |
| Immigrants | Uruguay | 1.2 /100 | #246 | Tragic 97.1% |
| Ethiopians | 1.2 /100 | #247 | Tragic 97.1% |
| Immigrants | Asia | 1.2 /100 | #248 | Tragic 97.1% |
| Immigrants | Africa | 1.0 /100 | #249 | Tragic 97.1% |
| Immigrants | Senegal | 0.9 /100 | #250 | Tragic 97.1% |
| South Americans | 0.8 /100 | #251 | Tragic 97.1% |
| Jamaicans | 0.8 /100 | #252 | Tragic 97.1% |
| Immigrants | Liberia | 0.8 /100 | #253 | Tragic 97.1% |
| Immigrants | Middle Africa | 0.8 /100 | #254 | Tragic 97.1% |
| Peruvians | 0.7 /100 | #255 | Tragic 97.1% |
| Bolivians | 0.7 /100 | #256 | Tragic 97.1% |
| Immigrants | Congo | 0.5 /100 | #257 | Tragic 97.0% |