Russian vs British West Indian 5th Grade
COMPARE
Russian
British West Indian
5th Grade
5th Grade Comparison
Russians
British West Indians
97.9%
5TH GRADE
99.7/ 100
METRIC RATING
63rd/ 347
METRIC RANK
96.5%
5TH GRADE
0.0/ 100
METRIC RATING
290th/ 347
METRIC RANK
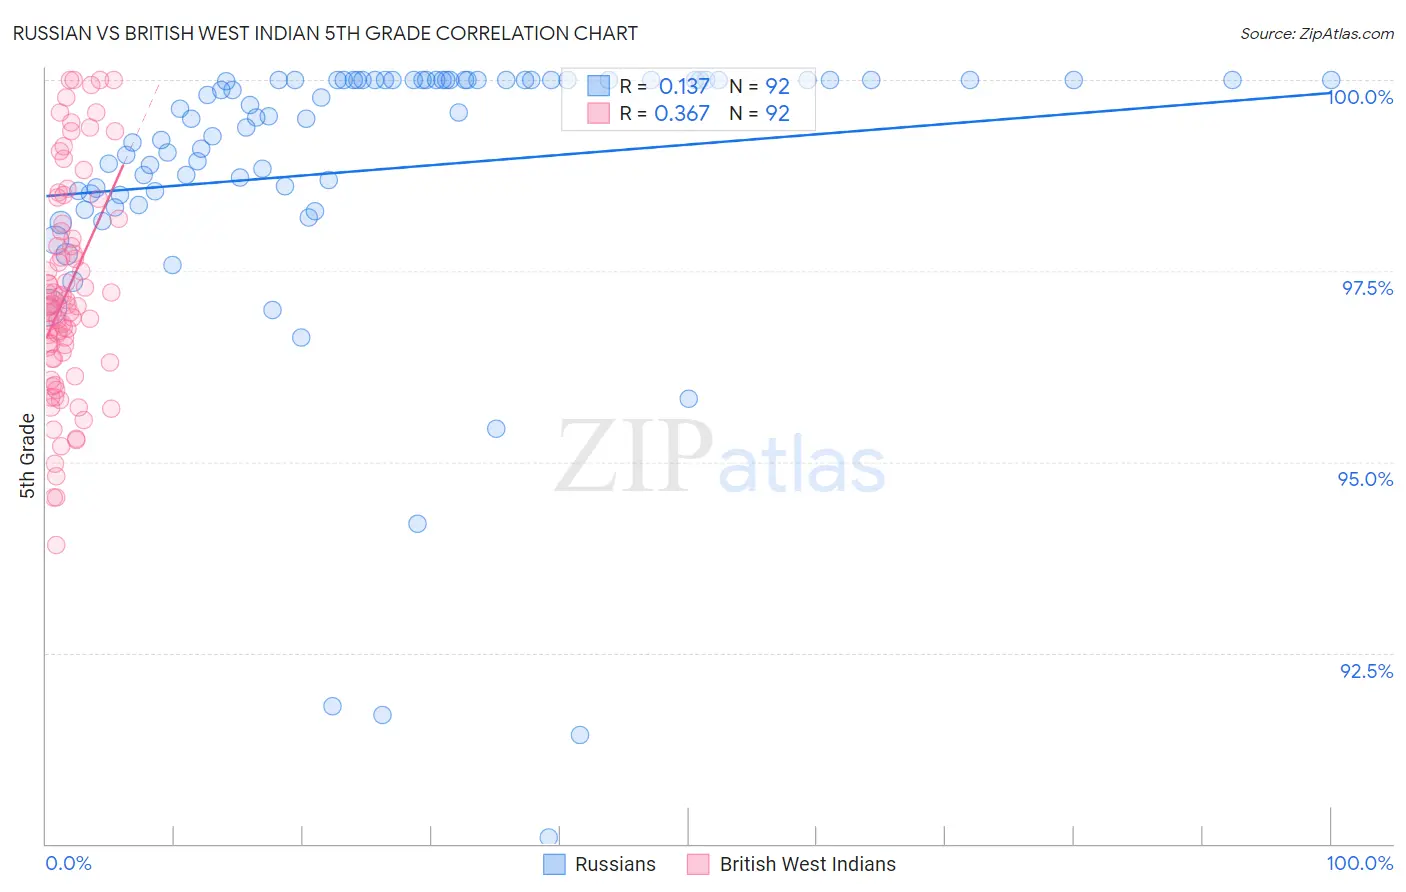
Russian vs British West Indian 5th Grade Correlation Chart
The statistical analysis conducted on geographies consisting of 512,259,139 people shows a poor positive correlation between the proportion of Russians and percentage of population with at least 5th grade education in the United States with a correlation coefficient (R) of 0.137 and weighted average of 97.9%. Similarly, the statistical analysis conducted on geographies consisting of 152,691,173 people shows a mild positive correlation between the proportion of British West Indians and percentage of population with at least 5th grade education in the United States with a correlation coefficient (R) of 0.367 and weighted average of 96.5%, a difference of 1.5%.
5th Grade Correlation Summary
| Measurement | Russian | British West Indian |
| Minimum | 90.1% | 93.9% |
| Maximum | 100.0% | 100.0% |
| Range | 9.9% | 6.1% |
| Mean | 98.8% | 97.2% |
| Median | 99.5% | 97.0% |
| Interquartile 25% (IQ1) | 98.5% | 96.3% |
| Interquartile 75% (IQ3) | 100.0% | 98.1% |
| Interquartile Range (IQR) | 1.5% | 1.7% |
| Standard Deviation (Sample) | 2.0% | 1.4% |
| Standard Deviation (Population) | 2.0% | 1.4% |
Similar Demographics by 5th Grade
Demographics Similar to Russians by 5th Grade
In terms of 5th grade, the demographic groups most similar to Russians are Immigrants from Canada (97.9%, a difference of 0.010%), Serbian (97.9%, a difference of 0.010%), Immigrants from North America (97.9%, a difference of 0.010%), American (97.9%, a difference of 0.020%), and Immigrants from Northern Europe (97.9%, a difference of 0.020%).
| Demographics | Rating | Rank | 5th Grade |
| Greeks | 99.8 /100 | #56 | Exceptional 97.9% |
| Austrians | 99.8 /100 | #57 | Exceptional 97.9% |
| Whites/Caucasians | 99.8 /100 | #58 | Exceptional 97.9% |
| Americans | 99.7 /100 | #59 | Exceptional 97.9% |
| Immigrants | Canada | 99.7 /100 | #60 | Exceptional 97.9% |
| Serbians | 99.7 /100 | #61 | Exceptional 97.9% |
| Immigrants | North America | 99.7 /100 | #62 | Exceptional 97.9% |
| Russians | 99.7 /100 | #63 | Exceptional 97.9% |
| Immigrants | Northern Europe | 99.6 /100 | #64 | Exceptional 97.9% |
| Canadians | 99.6 /100 | #65 | Exceptional 97.9% |
| Immigrants | Austria | 99.6 /100 | #66 | Exceptional 97.9% |
| New Zealanders | 99.6 /100 | #67 | Exceptional 97.9% |
| Cajuns | 99.6 /100 | #68 | Exceptional 97.9% |
| Kiowa | 99.5 /100 | #69 | Exceptional 97.9% |
| Iranians | 99.5 /100 | #70 | Exceptional 97.9% |
Demographics Similar to British West Indians by 5th Grade
In terms of 5th grade, the demographic groups most similar to British West Indians are Malaysian (96.5%, a difference of 0.0%), Somali (96.5%, a difference of 0.010%), Immigrants from West Indies (96.5%, a difference of 0.020%), Immigrants from Grenada (96.5%, a difference of 0.020%), and Immigrants from Eritrea (96.4%, a difference of 0.060%).
| Demographics | Rating | Rank | 5th Grade |
| Fijians | 0.1 /100 | #283 | Tragic 96.6% |
| Immigrants | Trinidad and Tobago | 0.1 /100 | #284 | Tragic 96.6% |
| Immigrants | St. Vincent and the Grenadines | 0.1 /100 | #285 | Tragic 96.6% |
| Immigrants | Thailand | 0.1 /100 | #286 | Tragic 96.6% |
| Immigrants | Afghanistan | 0.1 /100 | #287 | Tragic 96.6% |
| Immigrants | Barbados | 0.0 /100 | #288 | Tragic 96.6% |
| Immigrants | West Indies | 0.0 /100 | #289 | Tragic 96.5% |
| British West Indians | 0.0 /100 | #290 | Tragic 96.5% |
| Malaysians | 0.0 /100 | #291 | Tragic 96.5% |
| Somalis | 0.0 /100 | #292 | Tragic 96.5% |
| Immigrants | Grenada | 0.0 /100 | #293 | Tragic 96.5% |
| Immigrants | Eritrea | 0.0 /100 | #294 | Tragic 96.4% |
| Immigrants | Somalia | 0.0 /100 | #295 | Tragic 96.4% |
| Immigrants | South Eastern Asia | 0.0 /100 | #296 | Tragic 96.3% |
| Haitians | 0.0 /100 | #297 | Tragic 96.3% |