Jamaican vs Immigrants from Kuwait Kindergarten
COMPARE
Jamaican
Immigrants from Kuwait
Kindergarten
Kindergarten Comparison
Jamaicans
Immigrants from Kuwait
97.6%
KINDERGARTEN
0.6/ 100
METRIC RATING
258th/ 347
METRIC RANK
98.1%
KINDERGARTEN
89.2/ 100
METRIC RATING
135th/ 347
METRIC RANK
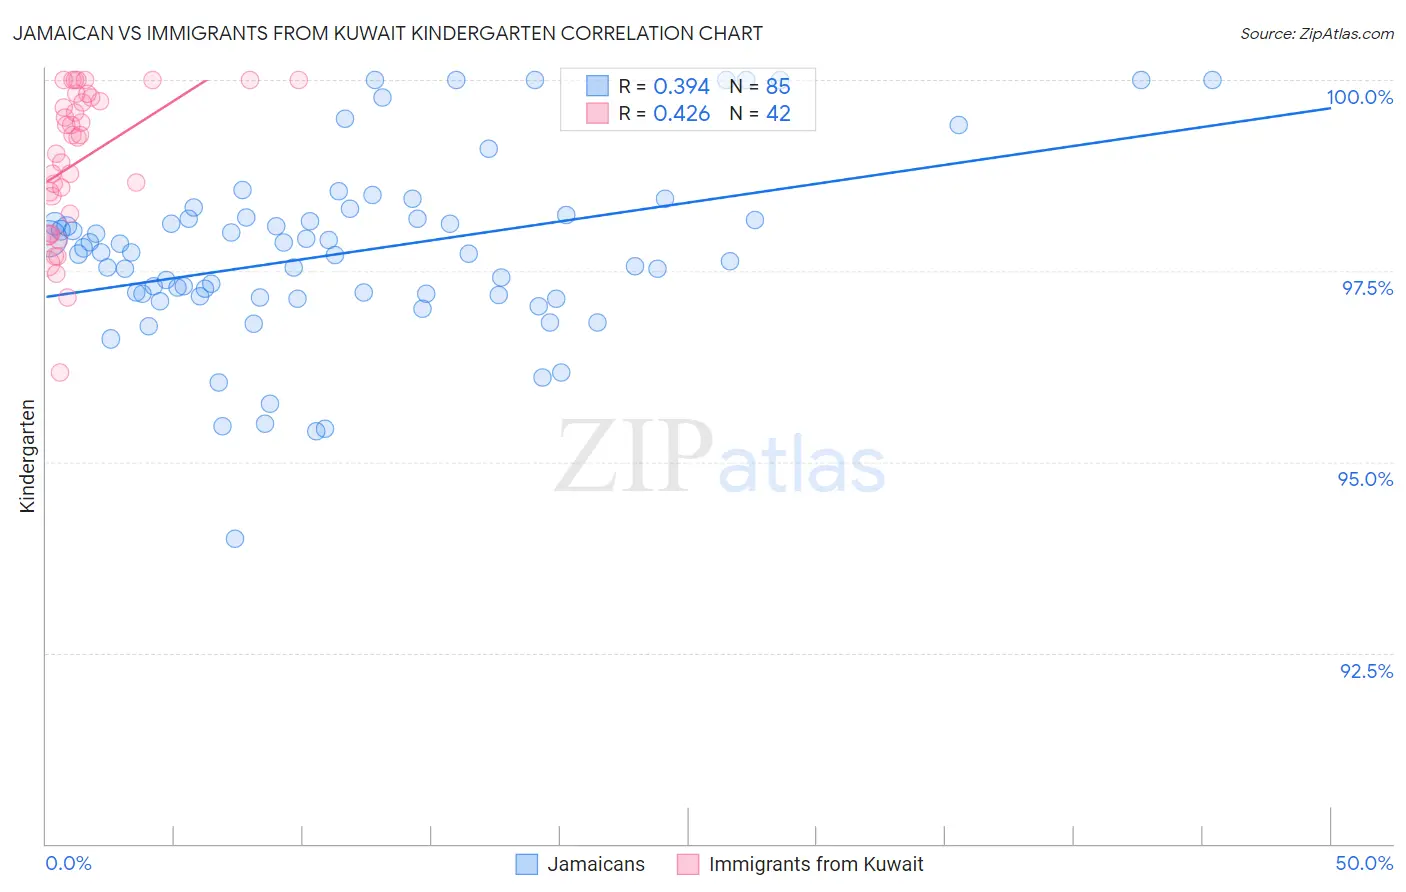
Jamaican vs Immigrants from Kuwait Kindergarten Correlation Chart
The statistical analysis conducted on geographies consisting of 368,084,732 people shows a mild positive correlation between the proportion of Jamaicans and percentage of population with at least kindergarten education in the United States with a correlation coefficient (R) of 0.394 and weighted average of 97.6%. Similarly, the statistical analysis conducted on geographies consisting of 136,913,666 people shows a moderate positive correlation between the proportion of Immigrants from Kuwait and percentage of population with at least kindergarten education in the United States with a correlation coefficient (R) of 0.426 and weighted average of 98.1%, a difference of 0.56%.
Kindergarten Correlation Summary
| Measurement | Jamaican | Immigrants from Kuwait |
| Minimum | 94.0% | 96.2% |
| Maximum | 100.0% | 100.0% |
| Range | 6.0% | 3.8% |
| Mean | 97.7% | 98.9% |
| Median | 97.7% | 99.3% |
| Interquartile 25% (IQ1) | 97.2% | 98.2% |
| Interquartile 75% (IQ3) | 98.2% | 99.8% |
| Interquartile Range (IQR) | 1.0% | 1.5% |
| Standard Deviation (Sample) | 1.2% | 0.96% |
| Standard Deviation (Population) | 1.2% | 0.95% |
Similar Demographics by Kindergarten
Demographics Similar to Jamaicans by Kindergarten
In terms of kindergarten, the demographic groups most similar to Jamaicans are Immigrants from Colombia (97.6%, a difference of 0.010%), Armenian (97.6%, a difference of 0.010%), Immigrants from Asia (97.6%, a difference of 0.020%), Immigrants from Congo (97.6%, a difference of 0.020%), and Yaqui (97.6%, a difference of 0.020%).
| Demographics | Rating | Rank | Kindergarten |
| Ethiopians | 0.9 /100 | #251 | Tragic 97.6% |
| Immigrants | Iraq | 0.9 /100 | #252 | Tragic 97.6% |
| Immigrants | Africa | 0.8 /100 | #253 | Tragic 97.6% |
| Immigrants | Asia | 0.8 /100 | #254 | Tragic 97.6% |
| Immigrants | Congo | 0.8 /100 | #255 | Tragic 97.6% |
| Yaqui | 0.7 /100 | #256 | Tragic 97.6% |
| Immigrants | Colombia | 0.6 /100 | #257 | Tragic 97.6% |
| Jamaicans | 0.6 /100 | #258 | Tragic 97.6% |
| Armenians | 0.5 /100 | #259 | Tragic 97.6% |
| Fijians | 0.5 /100 | #260 | Tragic 97.5% |
| Taiwanese | 0.4 /100 | #261 | Tragic 97.5% |
| Immigrants | Ethiopia | 0.4 /100 | #262 | Tragic 97.5% |
| Immigrants | South America | 0.4 /100 | #263 | Tragic 97.5% |
| Assyrians/Chaldeans/Syriacs | 0.4 /100 | #264 | Tragic 97.5% |
| Cubans | 0.3 /100 | #265 | Tragic 97.5% |
Demographics Similar to Immigrants from Kuwait by Kindergarten
In terms of kindergarten, the demographic groups most similar to Immigrants from Kuwait are Immigrants from Bulgaria (98.1%, a difference of 0.0%), Immigrants from Hungary (98.1%, a difference of 0.0%), Immigrants from Europe (98.1%, a difference of 0.010%), Blackfeet (98.1%, a difference of 0.010%), and Immigrants from Romania (98.1%, a difference of 0.010%).
| Demographics | Rating | Rank | Kindergarten |
| Immigrants | Serbia | 92.4 /100 | #128 | Exceptional 98.1% |
| Seminole | 91.5 /100 | #129 | Exceptional 98.1% |
| Immigrants | Croatia | 91.2 /100 | #130 | Exceptional 98.1% |
| Cambodians | 91.2 /100 | #131 | Exceptional 98.1% |
| Spaniards | 91.0 /100 | #132 | Exceptional 98.1% |
| Immigrants | Europe | 90.4 /100 | #133 | Exceptional 98.1% |
| Immigrants | Bulgaria | 89.4 /100 | #134 | Excellent 98.1% |
| Immigrants | Kuwait | 89.2 /100 | #135 | Excellent 98.1% |
| Immigrants | Hungary | 89.1 /100 | #136 | Excellent 98.1% |
| Blackfeet | 87.8 /100 | #137 | Excellent 98.1% |
| Immigrants | Romania | 87.7 /100 | #138 | Excellent 98.1% |
| Israelis | 87.7 /100 | #139 | Excellent 98.1% |
| Palestinians | 83.6 /100 | #140 | Excellent 98.1% |
| Marshallese | 83.0 /100 | #141 | Excellent 98.1% |
| Immigrants | Turkey | 82.8 /100 | #142 | Excellent 98.1% |