Immigrants from Chile vs Immigrants from Kuwait Kindergarten
COMPARE
Immigrants from Chile
Immigrants from Kuwait
Kindergarten
Kindergarten Comparison
Immigrants from Chile
Immigrants from Kuwait
97.8%
KINDERGARTEN
18.1/ 100
METRIC RATING
204th/ 347
METRIC RANK
98.1%
KINDERGARTEN
89.2/ 100
METRIC RATING
135th/ 347
METRIC RANK
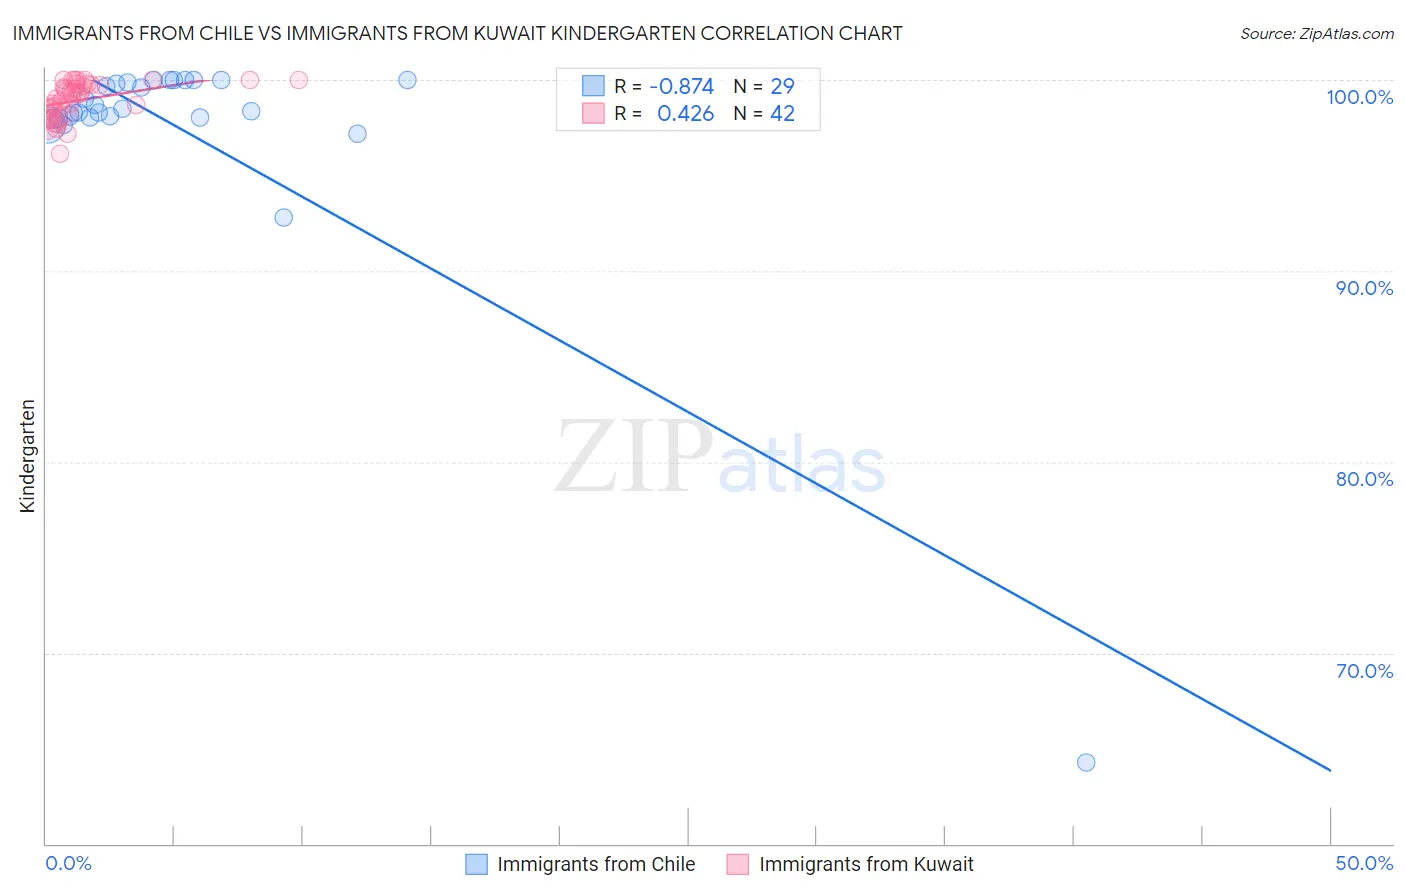
Immigrants from Chile vs Immigrants from Kuwait Kindergarten Correlation Chart
The statistical analysis conducted on geographies consisting of 218,647,266 people shows a very strong negative correlation between the proportion of Immigrants from Chile and percentage of population with at least kindergarten education in the United States with a correlation coefficient (R) of -0.874 and weighted average of 97.8%. Similarly, the statistical analysis conducted on geographies consisting of 136,913,666 people shows a moderate positive correlation between the proportion of Immigrants from Kuwait and percentage of population with at least kindergarten education in the United States with a correlation coefficient (R) of 0.426 and weighted average of 98.1%, a difference of 0.28%.
Kindergarten Correlation Summary
| Measurement | Immigrants from Chile | Immigrants from Kuwait |
| Minimum | 64.3% | 96.2% |
| Maximum | 100.0% | 100.0% |
| Range | 35.7% | 3.8% |
| Mean | 97.5% | 98.9% |
| Median | 98.3% | 99.3% |
| Interquartile 25% (IQ1) | 98.0% | 98.2% |
| Interquartile 75% (IQ3) | 99.9% | 99.8% |
| Interquartile Range (IQR) | 1.9% | 1.5% |
| Standard Deviation (Sample) | 6.5% | 0.96% |
| Standard Deviation (Population) | 6.4% | 0.95% |
Similar Demographics by Kindergarten
Demographics Similar to Immigrants from Chile by Kindergarten
In terms of kindergarten, the demographic groups most similar to Immigrants from Chile are Immigrants from Uganda (97.8%, a difference of 0.0%), Immigrants from Southern Europe (97.8%, a difference of 0.0%), Immigrants from Lebanon (97.9%, a difference of 0.010%), Immigrants from Ukraine (97.8%, a difference of 0.010%), and Immigrants from Albania (97.8%, a difference of 0.010%).
| Demographics | Rating | Rank | Kindergarten |
| Immigrants | Kenya | 25.5 /100 | #197 | Fair 97.9% |
| Tohono O'odham | 24.6 /100 | #198 | Fair 97.9% |
| Immigrants | Egypt | 22.3 /100 | #199 | Fair 97.9% |
| Yuman | 21.6 /100 | #200 | Fair 97.9% |
| Immigrants | Lebanon | 20.9 /100 | #201 | Fair 97.9% |
| Immigrants | Ukraine | 19.1 /100 | #202 | Poor 97.8% |
| Immigrants | Uganda | 18.8 /100 | #203 | Poor 97.8% |
| Immigrants | Chile | 18.1 /100 | #204 | Poor 97.8% |
| Immigrants | Southern Europe | 18.0 /100 | #205 | Poor 97.8% |
| Immigrants | Albania | 16.4 /100 | #206 | Poor 97.8% |
| Africans | 16.1 /100 | #207 | Poor 97.8% |
| Immigrants | Northern Africa | 12.0 /100 | #208 | Poor 97.8% |
| Costa Ricans | 11.6 /100 | #209 | Poor 97.8% |
| Immigrants | Oceania | 11.1 /100 | #210 | Poor 97.8% |
| Laotians | 10.5 /100 | #211 | Poor 97.8% |
Demographics Similar to Immigrants from Kuwait by Kindergarten
In terms of kindergarten, the demographic groups most similar to Immigrants from Kuwait are Immigrants from Bulgaria (98.1%, a difference of 0.0%), Immigrants from Hungary (98.1%, a difference of 0.0%), Immigrants from Europe (98.1%, a difference of 0.010%), Blackfeet (98.1%, a difference of 0.010%), and Immigrants from Romania (98.1%, a difference of 0.010%).
| Demographics | Rating | Rank | Kindergarten |
| Immigrants | Serbia | 92.4 /100 | #128 | Exceptional 98.1% |
| Seminole | 91.5 /100 | #129 | Exceptional 98.1% |
| Immigrants | Croatia | 91.2 /100 | #130 | Exceptional 98.1% |
| Cambodians | 91.2 /100 | #131 | Exceptional 98.1% |
| Spaniards | 91.0 /100 | #132 | Exceptional 98.1% |
| Immigrants | Europe | 90.4 /100 | #133 | Exceptional 98.1% |
| Immigrants | Bulgaria | 89.4 /100 | #134 | Excellent 98.1% |
| Immigrants | Kuwait | 89.2 /100 | #135 | Excellent 98.1% |
| Immigrants | Hungary | 89.1 /100 | #136 | Excellent 98.1% |
| Blackfeet | 87.8 /100 | #137 | Excellent 98.1% |
| Immigrants | Romania | 87.7 /100 | #138 | Excellent 98.1% |
| Israelis | 87.7 /100 | #139 | Excellent 98.1% |
| Palestinians | 83.6 /100 | #140 | Excellent 98.1% |
| Marshallese | 83.0 /100 | #141 | Excellent 98.1% |
| Immigrants | Turkey | 82.8 /100 | #142 | Excellent 98.1% |