Comanche vs Immigrants from Kuwait Kindergarten
COMPARE
Comanche
Immigrants from Kuwait
Kindergarten
Kindergarten Comparison
Comanche
Immigrants from Kuwait
98.0%
KINDERGARTEN
68.3/ 100
METRIC RATING
155th/ 347
METRIC RANK
98.1%
KINDERGARTEN
89.2/ 100
METRIC RATING
135th/ 347
METRIC RANK
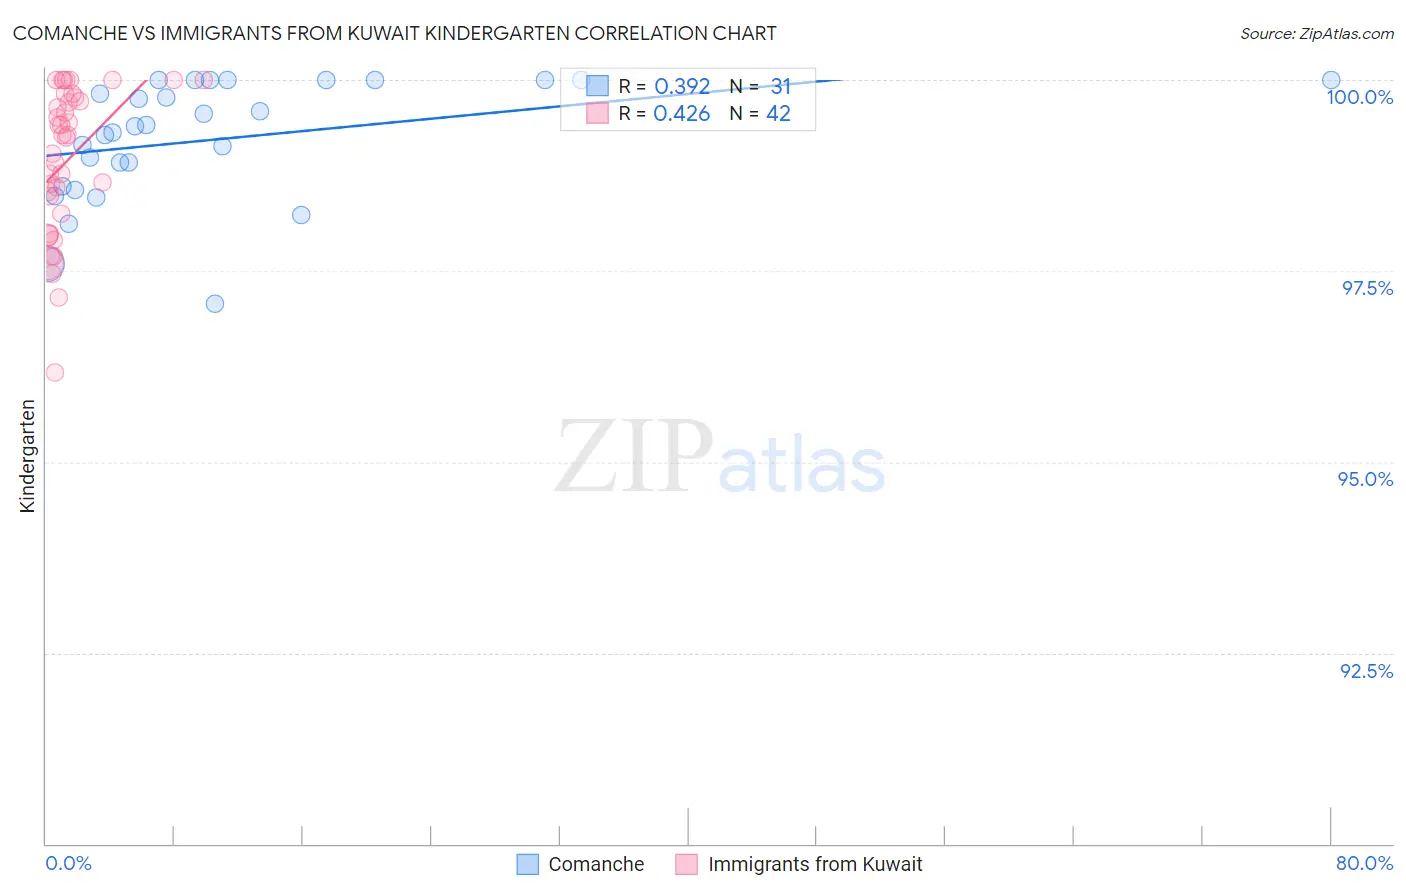
Comanche vs Immigrants from Kuwait Kindergarten Correlation Chart
The statistical analysis conducted on geographies consisting of 109,786,530 people shows a mild positive correlation between the proportion of Comanche and percentage of population with at least kindergarten education in the United States with a correlation coefficient (R) of 0.392 and weighted average of 98.0%. Similarly, the statistical analysis conducted on geographies consisting of 136,913,666 people shows a moderate positive correlation between the proportion of Immigrants from Kuwait and percentage of population with at least kindergarten education in the United States with a correlation coefficient (R) of 0.426 and weighted average of 98.1%, a difference of 0.10%.
Kindergarten Correlation Summary
| Measurement | Comanche | Immigrants from Kuwait |
| Minimum | 97.1% | 96.2% |
| Maximum | 100.0% | 100.0% |
| Range | 2.9% | 3.8% |
| Mean | 99.2% | 98.9% |
| Median | 99.4% | 99.3% |
| Interquartile 25% (IQ1) | 98.6% | 98.2% |
| Interquartile 75% (IQ3) | 100.0% | 99.8% |
| Interquartile Range (IQR) | 1.4% | 1.5% |
| Standard Deviation (Sample) | 0.78% | 0.96% |
| Standard Deviation (Population) | 0.77% | 0.95% |
Demographics Similar to Comanche and Immigrants from Kuwait by Kindergarten
In terms of kindergarten, the demographic groups most similar to Comanche are Immigrants from Moldova (98.0%, a difference of 0.0%), Immigrants from Iran (98.0%, a difference of 0.0%), Soviet Union (98.0%, a difference of 0.010%), Dutch West Indian (98.0%, a difference of 0.010%), and Jordanian (98.0%, a difference of 0.020%). Similarly, the demographic groups most similar to Immigrants from Kuwait are Immigrants from Hungary (98.1%, a difference of 0.0%), Blackfeet (98.1%, a difference of 0.010%), Immigrants from Romania (98.1%, a difference of 0.010%), Israeli (98.1%, a difference of 0.010%), and Palestinian (98.1%, a difference of 0.040%).
| Demographics | Rating | Rank | Kindergarten |
| Immigrants | Kuwait | 89.2 /100 | #135 | Excellent 98.1% |
| Immigrants | Hungary | 89.1 /100 | #136 | Excellent 98.1% |
| Blackfeet | 87.8 /100 | #137 | Excellent 98.1% |
| Immigrants | Romania | 87.7 /100 | #138 | Excellent 98.1% |
| Israelis | 87.7 /100 | #139 | Excellent 98.1% |
| Palestinians | 83.6 /100 | #140 | Excellent 98.1% |
| Marshallese | 83.0 /100 | #141 | Excellent 98.1% |
| Immigrants | Turkey | 82.8 /100 | #142 | Excellent 98.1% |
| Burmese | 81.5 /100 | #143 | Excellent 98.1% |
| Alsatians | 80.4 /100 | #144 | Excellent 98.1% |
| Hmong | 78.8 /100 | #145 | Good 98.1% |
| Filipinos | 78.3 /100 | #146 | Good 98.0% |
| Immigrants | Israel | 77.6 /100 | #147 | Good 98.0% |
| Apache | 75.0 /100 | #148 | Good 98.0% |
| Immigrants | Greece | 74.9 /100 | #149 | Good 98.0% |
| Jordanians | 72.8 /100 | #150 | Good 98.0% |
| Soviet Union | 70.8 /100 | #151 | Good 98.0% |
| Dutch West Indians | 70.1 /100 | #152 | Good 98.0% |
| Immigrants | Moldova | 69.1 /100 | #153 | Good 98.0% |
| Immigrants | Iran | 68.8 /100 | #154 | Good 98.0% |
| Comanche | 68.3 /100 | #155 | Good 98.0% |