Immigrants from Sweden vs Basque 4th Grade
COMPARE
Immigrants from Sweden
Basque
4th Grade
4th Grade Comparison
Immigrants from Sweden
Basques
97.9%
4TH GRADE
98.7/ 100
METRIC RATING
91st/ 347
METRIC RANK
97.8%
4TH GRADE
95.8/ 100
METRIC RATING
113th/ 347
METRIC RANK
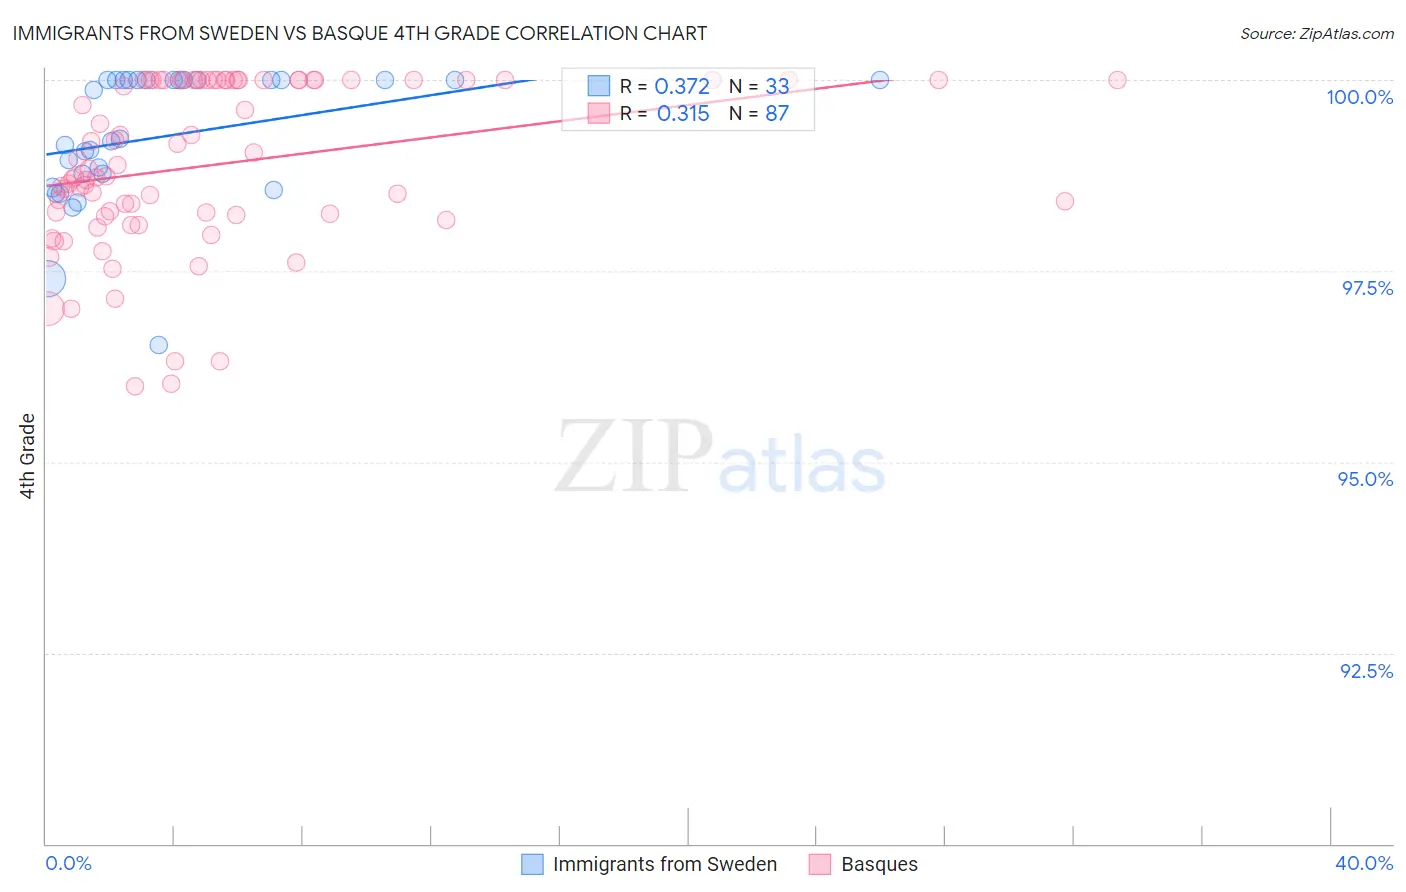
Immigrants from Sweden vs Basque 4th Grade Correlation Chart
The statistical analysis conducted on geographies consisting of 164,737,092 people shows a mild positive correlation between the proportion of Immigrants from Sweden and percentage of population with at least 4th grade education in the United States with a correlation coefficient (R) of 0.372 and weighted average of 97.9%. Similarly, the statistical analysis conducted on geographies consisting of 165,774,137 people shows a mild positive correlation between the proportion of Basques and percentage of population with at least 4th grade education in the United States with a correlation coefficient (R) of 0.315 and weighted average of 97.8%, a difference of 0.12%.
4th Grade Correlation Summary
| Measurement | Immigrants from Sweden | Basque |
| Minimum | 96.5% | 96.0% |
| Maximum | 100.0% | 100.0% |
| Range | 3.5% | 4.0% |
| Mean | 99.3% | 98.9% |
| Median | 99.2% | 98.8% |
| Interquartile 25% (IQ1) | 98.7% | 98.2% |
| Interquartile 75% (IQ3) | 100.0% | 100.0% |
| Interquartile Range (IQR) | 1.3% | 1.8% |
| Standard Deviation (Sample) | 0.86% | 1.1% |
| Standard Deviation (Population) | 0.85% | 1.1% |
Similar Demographics by 4th Grade
Demographics Similar to Immigrants from Sweden by 4th Grade
In terms of 4th grade, the demographic groups most similar to Immigrants from Sweden are Zimbabwean (97.9%, a difference of 0.0%), Immigrants from South Africa (97.9%, a difference of 0.0%), Delaware (97.9%, a difference of 0.0%), Immigrants from Denmark (97.9%, a difference of 0.0%), and Immigrants from Western Europe (97.9%, a difference of 0.0%).
| Demographics | Rating | Rank | 4th Grade |
| Cypriots | 98.9 /100 | #84 | Exceptional 97.9% |
| Potawatomi | 98.9 /100 | #85 | Exceptional 97.9% |
| Immigrants | Australia | 98.8 /100 | #86 | Exceptional 97.9% |
| Zimbabweans | 98.8 /100 | #87 | Exceptional 97.9% |
| Immigrants | South Africa | 98.8 /100 | #88 | Exceptional 97.9% |
| Delaware | 98.8 /100 | #89 | Exceptional 97.9% |
| Immigrants | Denmark | 98.7 /100 | #90 | Exceptional 97.9% |
| Immigrants | Sweden | 98.7 /100 | #91 | Exceptional 97.9% |
| Immigrants | Western Europe | 98.7 /100 | #92 | Exceptional 97.9% |
| Immigrants | Ireland | 98.7 /100 | #93 | Exceptional 97.9% |
| Shoshone | 98.7 /100 | #94 | Exceptional 97.9% |
| Immigrants | Germany | 98.5 /100 | #95 | Exceptional 97.9% |
| Romanians | 98.4 /100 | #96 | Exceptional 97.9% |
| Cheyenne | 98.4 /100 | #97 | Exceptional 97.9% |
| South Africans | 98.2 /100 | #98 | Exceptional 97.9% |
Demographics Similar to Basques by 4th Grade
In terms of 4th grade, the demographic groups most similar to Basques are Okinawan (97.8%, a difference of 0.0%), Immigrants from Switzerland (97.8%, a difference of 0.010%), Iroquois (97.8%, a difference of 0.010%), Lebanese (97.8%, a difference of 0.010%), and Immigrants from Croatia (97.8%, a difference of 0.010%).
| Demographics | Rating | Rank | 4th Grade |
| Immigrants | Czechoslovakia | 97.5 /100 | #106 | Exceptional 97.9% |
| Bhutanese | 97.4 /100 | #107 | Exceptional 97.9% |
| Immigrants | Singapore | 97.3 /100 | #108 | Exceptional 97.9% |
| Immigrants | Latvia | 96.8 /100 | #109 | Exceptional 97.8% |
| Thais | 96.7 /100 | #110 | Exceptional 97.8% |
| Immigrants | Switzerland | 96.1 /100 | #111 | Exceptional 97.8% |
| Okinawans | 96.0 /100 | #112 | Exceptional 97.8% |
| Basques | 95.8 /100 | #113 | Exceptional 97.8% |
| Iroquois | 95.4 /100 | #114 | Exceptional 97.8% |
| Lebanese | 95.4 /100 | #115 | Exceptional 97.8% |
| Immigrants | Croatia | 95.2 /100 | #116 | Exceptional 97.8% |
| Syrians | 94.9 /100 | #117 | Exceptional 97.8% |
| Menominee | 94.9 /100 | #118 | Exceptional 97.8% |
| Immigrants | Saudi Arabia | 94.8 /100 | #119 | Exceptional 97.8% |
| Immigrants | France | 94.8 /100 | #120 | Exceptional 97.8% |