Italian vs Immigrants from Congo High School Diploma
COMPARE
Italian
Immigrants from Congo
High School Diploma
High School Diploma Comparison
Italians
Immigrants from Congo
91.5%
HIGH SCHOOL DIPLOMA
99.9/ 100
METRIC RATING
24th/ 347
METRIC RANK
87.0%
HIGH SCHOOL DIPLOMA
0.2/ 100
METRIC RATING
266th/ 347
METRIC RANK
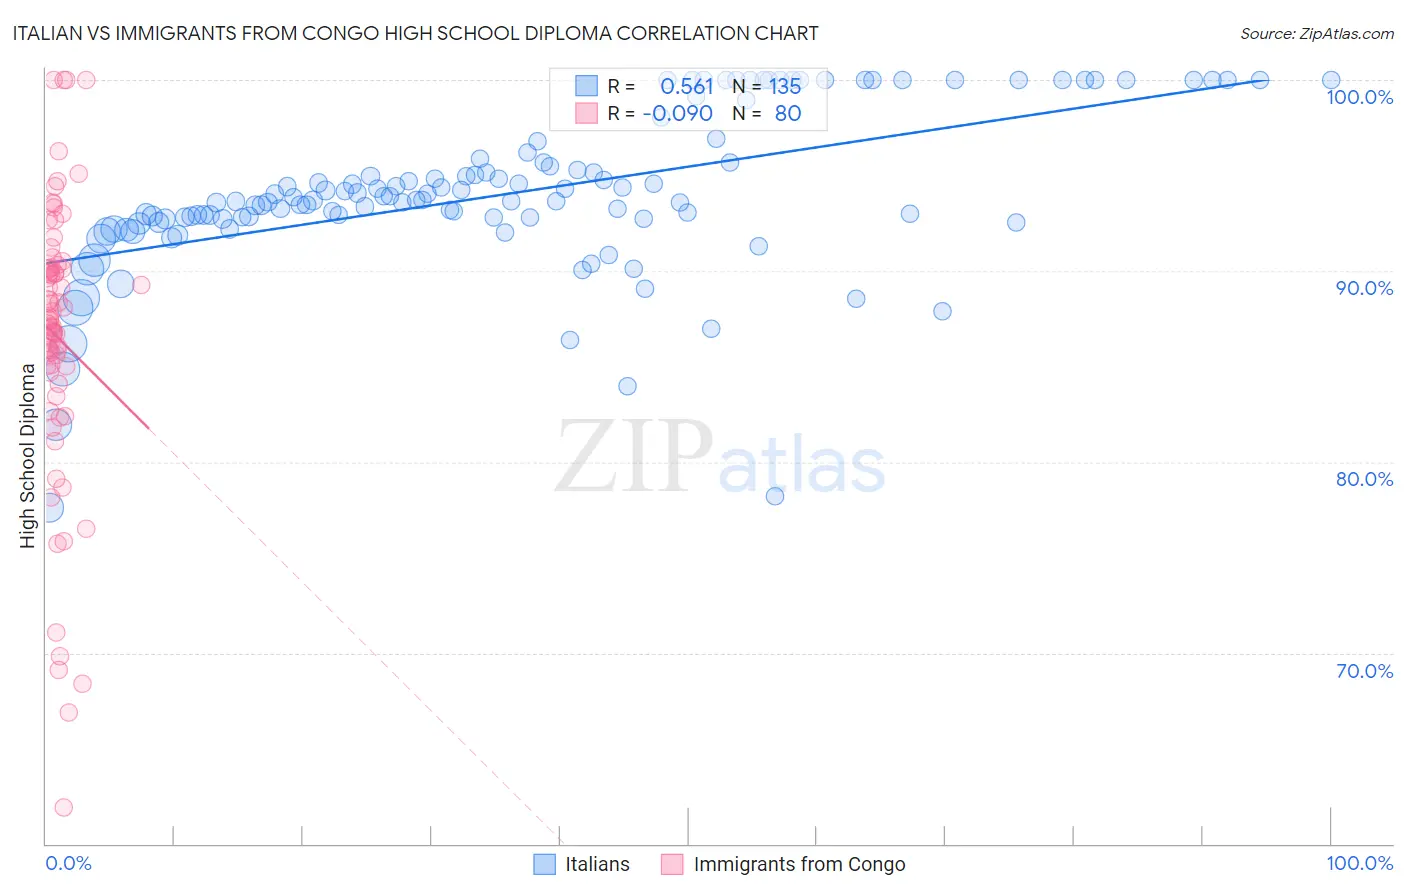
Italian vs Immigrants from Congo High School Diploma Correlation Chart
The statistical analysis conducted on geographies consisting of 575,116,589 people shows a substantial positive correlation between the proportion of Italians and percentage of population with at least high school diploma education in the United States with a correlation coefficient (R) of 0.561 and weighted average of 91.5%. Similarly, the statistical analysis conducted on geographies consisting of 92,134,351 people shows a slight negative correlation between the proportion of Immigrants from Congo and percentage of population with at least high school diploma education in the United States with a correlation coefficient (R) of -0.090 and weighted average of 87.0%, a difference of 5.2%.
High School Diploma Correlation Summary
| Measurement | Italian | Immigrants from Congo |
| Minimum | 77.6% | 61.9% |
| Maximum | 100.0% | 100.0% |
| Range | 22.4% | 38.1% |
| Mean | 94.0% | 86.5% |
| Median | 93.7% | 87.5% |
| Interquartile 25% (IQ1) | 92.7% | 84.8% |
| Interquartile 75% (IQ3) | 95.7% | 90.2% |
| Interquartile Range (IQR) | 2.9% | 5.3% |
| Standard Deviation (Sample) | 4.2% | 7.4% |
| Standard Deviation (Population) | 4.2% | 7.4% |
Similar Demographics by High School Diploma
Demographics Similar to Italians by High School Diploma
In terms of high school diploma, the demographic groups most similar to Italians are Scandinavian (91.5%, a difference of 0.0%), Thai (91.5%, a difference of 0.0%), Estonian (91.6%, a difference of 0.030%), Filipino (91.6%, a difference of 0.040%), and Czech (91.6%, a difference of 0.050%).
| Demographics | Rating | Rank | High School Diploma |
| Immigrants | Singapore | 99.9 /100 | #17 | Exceptional 91.7% |
| Germans | 99.9 /100 | #18 | Exceptional 91.7% |
| Maltese | 99.9 /100 | #19 | Exceptional 91.6% |
| Czechs | 99.9 /100 | #20 | Exceptional 91.6% |
| Filipinos | 99.9 /100 | #21 | Exceptional 91.6% |
| Estonians | 99.9 /100 | #22 | Exceptional 91.6% |
| Scandinavians | 99.9 /100 | #23 | Exceptional 91.5% |
| Italians | 99.9 /100 | #24 | Exceptional 91.5% |
| Thais | 99.9 /100 | #25 | Exceptional 91.5% |
| Russians | 99.9 /100 | #26 | Exceptional 91.5% |
| Cypriots | 99.9 /100 | #27 | Exceptional 91.5% |
| Tlingit-Haida | 99.9 /100 | #28 | Exceptional 91.4% |
| Europeans | 99.9 /100 | #29 | Exceptional 91.4% |
| Iranians | 99.9 /100 | #30 | Exceptional 91.4% |
| Immigrants | Northern Europe | 99.9 /100 | #31 | Exceptional 91.4% |
Demographics Similar to Immigrants from Congo by High School Diploma
In terms of high school diploma, the demographic groups most similar to Immigrants from Congo are Black/African American (87.0%, a difference of 0.010%), U.S. Virgin Islander (87.1%, a difference of 0.050%), Pennsylvania German (87.0%, a difference of 0.050%), Sri Lankan (87.0%, a difference of 0.050%), and Malaysian (87.0%, a difference of 0.070%).
| Demographics | Rating | Rank | High School Diploma |
| Immigrants | Western Africa | 0.5 /100 | #259 | Tragic 87.4% |
| Cajuns | 0.4 /100 | #260 | Tragic 87.3% |
| Seminole | 0.4 /100 | #261 | Tragic 87.3% |
| Immigrants | Peru | 0.4 /100 | #262 | Tragic 87.3% |
| Immigrants | South Eastern Asia | 0.3 /100 | #263 | Tragic 87.2% |
| Jamaicans | 0.3 /100 | #264 | Tragic 87.2% |
| U.S. Virgin Islanders | 0.2 /100 | #265 | Tragic 87.1% |
| Immigrants | Congo | 0.2 /100 | #266 | Tragic 87.0% |
| Blacks/African Americans | 0.2 /100 | #267 | Tragic 87.0% |
| Pennsylvania Germans | 0.2 /100 | #268 | Tragic 87.0% |
| Sri Lankans | 0.2 /100 | #269 | Tragic 87.0% |
| Malaysians | 0.2 /100 | #270 | Tragic 87.0% |
| West Indians | 0.1 /100 | #271 | Tragic 86.9% |
| Trinidadians and Tobagonians | 0.1 /100 | #272 | Tragic 86.9% |
| Immigrants | Jamaica | 0.1 /100 | #273 | Tragic 86.9% |