Italian vs Immigrants from Dominican Republic Kindergarten
COMPARE
Italian
Immigrants from Dominican Republic
Kindergarten
Kindergarten Comparison
Italians
Immigrants from Dominican Republic
98.5%
KINDERGARTEN
99.9/ 100
METRIC RATING
37th/ 347
METRIC RANK
96.6%
KINDERGARTEN
0.0/ 100
METRIC RATING
334th/ 347
METRIC RANK
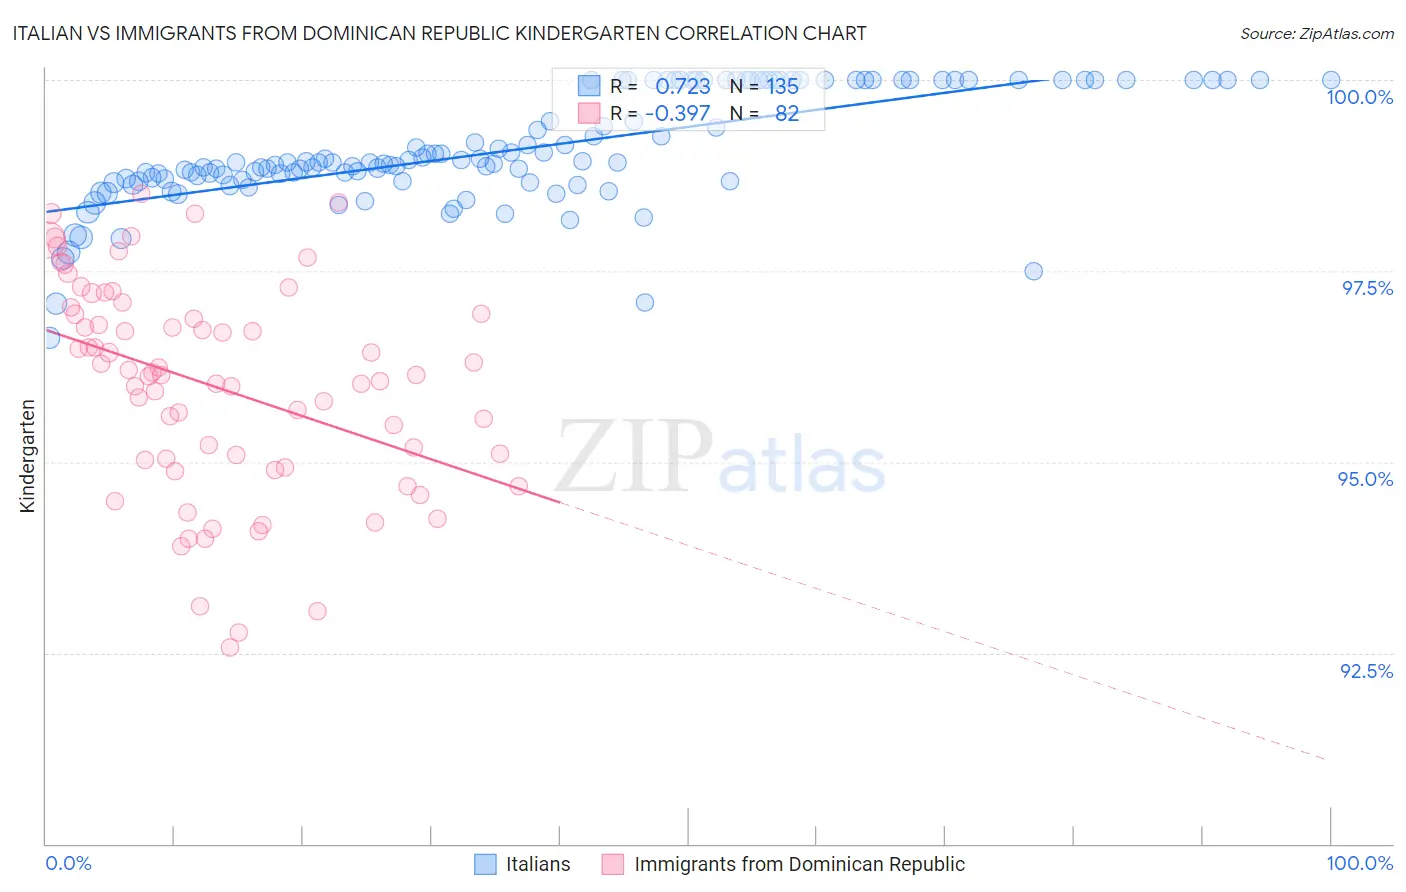
Italian vs Immigrants from Dominican Republic Kindergarten Correlation Chart
The statistical analysis conducted on geographies consisting of 575,115,824 people shows a strong positive correlation between the proportion of Italians and percentage of population with at least kindergarten education in the United States with a correlation coefficient (R) of 0.723 and weighted average of 98.5%. Similarly, the statistical analysis conducted on geographies consisting of 275,142,551 people shows a mild negative correlation between the proportion of Immigrants from Dominican Republic and percentage of population with at least kindergarten education in the United States with a correlation coefficient (R) of -0.397 and weighted average of 96.6%, a difference of 2.0%.
Kindergarten Correlation Summary
| Measurement | Italian | Immigrants from Dominican Republic |
| Minimum | 96.6% | 92.6% |
| Maximum | 100.0% | 98.5% |
| Range | 3.4% | 5.9% |
| Mean | 99.1% | 96.0% |
| Median | 98.9% | 96.1% |
| Interquartile 25% (IQ1) | 98.7% | 95.0% |
| Interquartile 75% (IQ3) | 100.0% | 96.9% |
| Interquartile Range (IQR) | 1.3% | 1.9% |
| Standard Deviation (Sample) | 0.73% | 1.4% |
| Standard Deviation (Population) | 0.72% | 1.4% |
Similar Demographics by Kindergarten
Demographics Similar to Italians by Kindergarten
In terms of kindergarten, the demographic groups most similar to Italians are Latvian (98.5%, a difference of 0.0%), Chippewa (98.5%, a difference of 0.010%), Luxembourger (98.5%, a difference of 0.010%), British (98.5%, a difference of 0.020%), and Eastern European (98.5%, a difference of 0.020%).
| Demographics | Rating | Rank | Kindergarten |
| Europeans | 100.0 /100 | #30 | Exceptional 98.6% |
| Czechs | 100.0 /100 | #31 | Exceptional 98.6% |
| French Canadians | 100.0 /100 | #32 | Exceptional 98.6% |
| Scandinavians | 100.0 /100 | #33 | Exceptional 98.6% |
| Chinese | 100.0 /100 | #34 | Exceptional 98.5% |
| Swiss | 100.0 /100 | #35 | Exceptional 98.5% |
| British | 99.9 /100 | #36 | Exceptional 98.5% |
| Italians | 99.9 /100 | #37 | Exceptional 98.5% |
| Latvians | 99.9 /100 | #38 | Exceptional 98.5% |
| Chippewa | 99.9 /100 | #39 | Exceptional 98.5% |
| Luxembourgers | 99.9 /100 | #40 | Exceptional 98.5% |
| Eastern Europeans | 99.9 /100 | #41 | Exceptional 98.5% |
| Native Hawaiians | 99.9 /100 | #42 | Exceptional 98.5% |
| Lumbee | 99.9 /100 | #43 | Exceptional 98.5% |
| Northern Europeans | 99.9 /100 | #44 | Exceptional 98.5% |
Demographics Similar to Immigrants from Dominican Republic by Kindergarten
In terms of kindergarten, the demographic groups most similar to Immigrants from Dominican Republic are Bangladeshi (96.6%, a difference of 0.0%), Central American (96.6%, a difference of 0.020%), Yakama (96.6%, a difference of 0.040%), Guatemalan (96.5%, a difference of 0.040%), and Immigrants from Armenia (96.6%, a difference of 0.060%).
| Demographics | Rating | Rank | Kindergarten |
| Mexicans | 0.0 /100 | #327 | Tragic 96.7% |
| Immigrants | Latin America | 0.0 /100 | #328 | Tragic 96.7% |
| Immigrants | Vietnam | 0.0 /100 | #329 | Tragic 96.7% |
| Japanese | 0.0 /100 | #330 | Tragic 96.7% |
| Immigrants | Armenia | 0.0 /100 | #331 | Tragic 96.6% |
| Yakama | 0.0 /100 | #332 | Tragic 96.6% |
| Central Americans | 0.0 /100 | #333 | Tragic 96.6% |
| Immigrants | Dominican Republic | 0.0 /100 | #334 | Tragic 96.6% |
| Bangladeshis | 0.0 /100 | #335 | Tragic 96.6% |
| Guatemalans | 0.0 /100 | #336 | Tragic 96.5% |
| Immigrants | Cambodia | 0.0 /100 | #337 | Tragic 96.5% |
| Immigrants | Fiji | 0.0 /100 | #338 | Tragic 96.5% |
| Immigrants | Guatemala | 0.0 /100 | #339 | Tragic 96.4% |
| Immigrants | Central America | 0.0 /100 | #340 | Tragic 96.4% |
| Immigrants | Cabo Verde | 0.0 /100 | #341 | Tragic 96.4% |