Immigrants from Spain vs Kenyan 12th Grade, No Diploma
COMPARE
Immigrants from Spain
Kenyan
12th Grade, No Diploma
12th Grade, No Diploma Comparison
Immigrants from Spain
Kenyans
91.6%
12TH GRADE, NO DIPLOMA
80.1/ 100
METRIC RATING
144th/ 347
METRIC RANK
91.5%
12TH GRADE, NO DIPLOMA
77.4/ 100
METRIC RATING
152nd/ 347
METRIC RANK
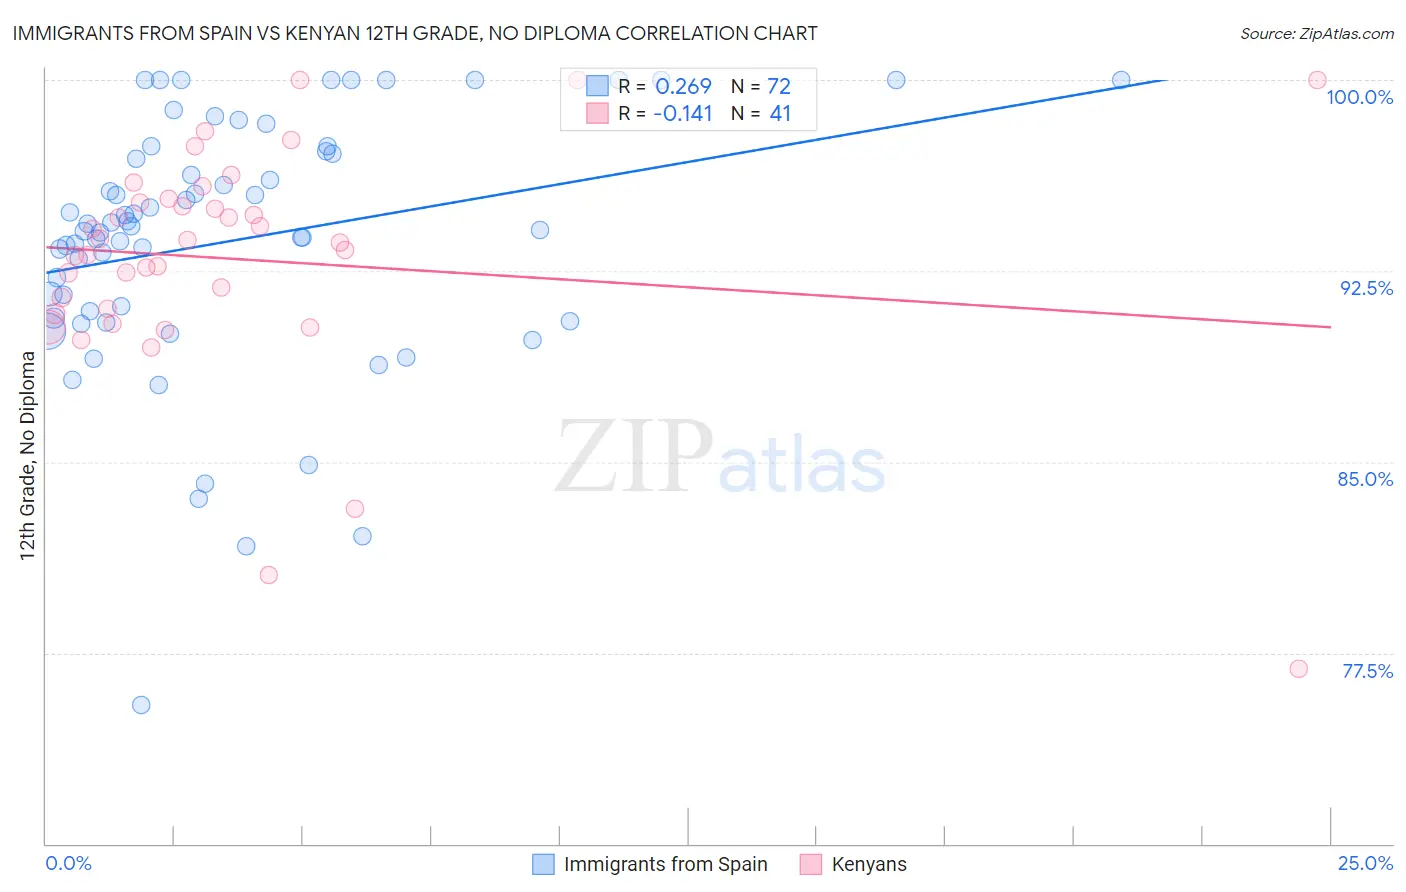
Immigrants from Spain vs Kenyan 12th Grade, No Diploma Correlation Chart
The statistical analysis conducted on geographies consisting of 239,682,725 people shows a weak positive correlation between the proportion of Immigrants from Spain and percentage of population with at least 12th grade (no diploma) education in the United States with a correlation coefficient (R) of 0.269 and weighted average of 91.6%. Similarly, the statistical analysis conducted on geographies consisting of 168,243,895 people shows a poor negative correlation between the proportion of Kenyans and percentage of population with at least 12th grade (no diploma) education in the United States with a correlation coefficient (R) of -0.141 and weighted average of 91.5%, a difference of 0.050%.
12th Grade, No Diploma Correlation Summary
| Measurement | Immigrants from Spain | Kenyan |
| Minimum | 75.4% | 76.9% |
| Maximum | 100.0% | 100.0% |
| Range | 24.6% | 23.1% |
| Mean | 93.7% | 92.9% |
| Median | 94.2% | 93.6% |
| Interquartile 25% (IQ1) | 90.8% | 90.9% |
| Interquartile 75% (IQ3) | 97.2% | 95.3% |
| Interquartile Range (IQR) | 6.4% | 4.3% |
| Standard Deviation (Sample) | 5.0% | 4.6% |
| Standard Deviation (Population) | 4.9% | 4.5% |
Demographics Similar to Immigrants from Spain and Kenyans by 12th Grade, No Diploma
In terms of 12th grade, no diploma, the demographic groups most similar to Immigrants from Spain are Immigrants from Lebanon (91.6%, a difference of 0.0%), Immigrants from Argentina (91.6%, a difference of 0.010%), Immigrants from Brazil (91.5%, a difference of 0.010%), Pakistani (91.5%, a difference of 0.010%), and Indian (Asian) (91.5%, a difference of 0.010%). Similarly, the demographic groups most similar to Kenyans are Ugandan (91.5%, a difference of 0.030%), Paraguayan (91.5%, a difference of 0.030%), Chippewa (91.5%, a difference of 0.030%), Iraqi (91.5%, a difference of 0.030%), and Immigrants from Brazil (91.5%, a difference of 0.040%).
| Demographics | Rating | Rank | 12th Grade, No Diploma |
| Arabs | 84.1 /100 | #138 | Excellent 91.6% |
| Immigrants | Egypt | 83.9 /100 | #139 | Excellent 91.6% |
| Immigrants | Poland | 82.3 /100 | #140 | Excellent 91.6% |
| Argentineans | 82.0 /100 | #141 | Excellent 91.6% |
| Immigrants | Venezuela | 80.9 /100 | #142 | Excellent 91.6% |
| Immigrants | Argentina | 80.7 /100 | #143 | Excellent 91.6% |
| Immigrants | Spain | 80.1 /100 | #144 | Excellent 91.6% |
| Immigrants | Lebanon | 80.0 /100 | #145 | Excellent 91.6% |
| Immigrants | Brazil | 79.8 /100 | #146 | Good 91.5% |
| Pakistanis | 79.6 /100 | #147 | Good 91.5% |
| Indians (Asian) | 79.4 /100 | #148 | Good 91.5% |
| Ugandans | 79.0 /100 | #149 | Good 91.5% |
| Paraguayans | 78.9 /100 | #150 | Good 91.5% |
| Chippewa | 78.8 /100 | #151 | Good 91.5% |
| Kenyans | 77.4 /100 | #152 | Good 91.5% |
| Iraqis | 75.3 /100 | #153 | Good 91.5% |
| Immigrants | Kenya | 73.9 /100 | #154 | Good 91.5% |
| Immigrants | Iraq | 73.0 /100 | #155 | Good 91.4% |
| Asians | 71.9 /100 | #156 | Good 91.4% |
| Immigrants | Pakistan | 70.7 /100 | #157 | Good 91.4% |
| Immigrants | Northern Africa | 66.2 /100 | #158 | Good 91.4% |