Iranian vs Immigrants from Moldova 3rd Grade
COMPARE
Iranian
Immigrants from Moldova
3rd Grade
3rd Grade Comparison
Iranians
Immigrants from Moldova
98.0%
3RD GRADE
94.9/ 100
METRIC RATING
118th/ 347
METRIC RANK
97.9%
3RD GRADE
77.1/ 100
METRIC RATING
148th/ 347
METRIC RANK
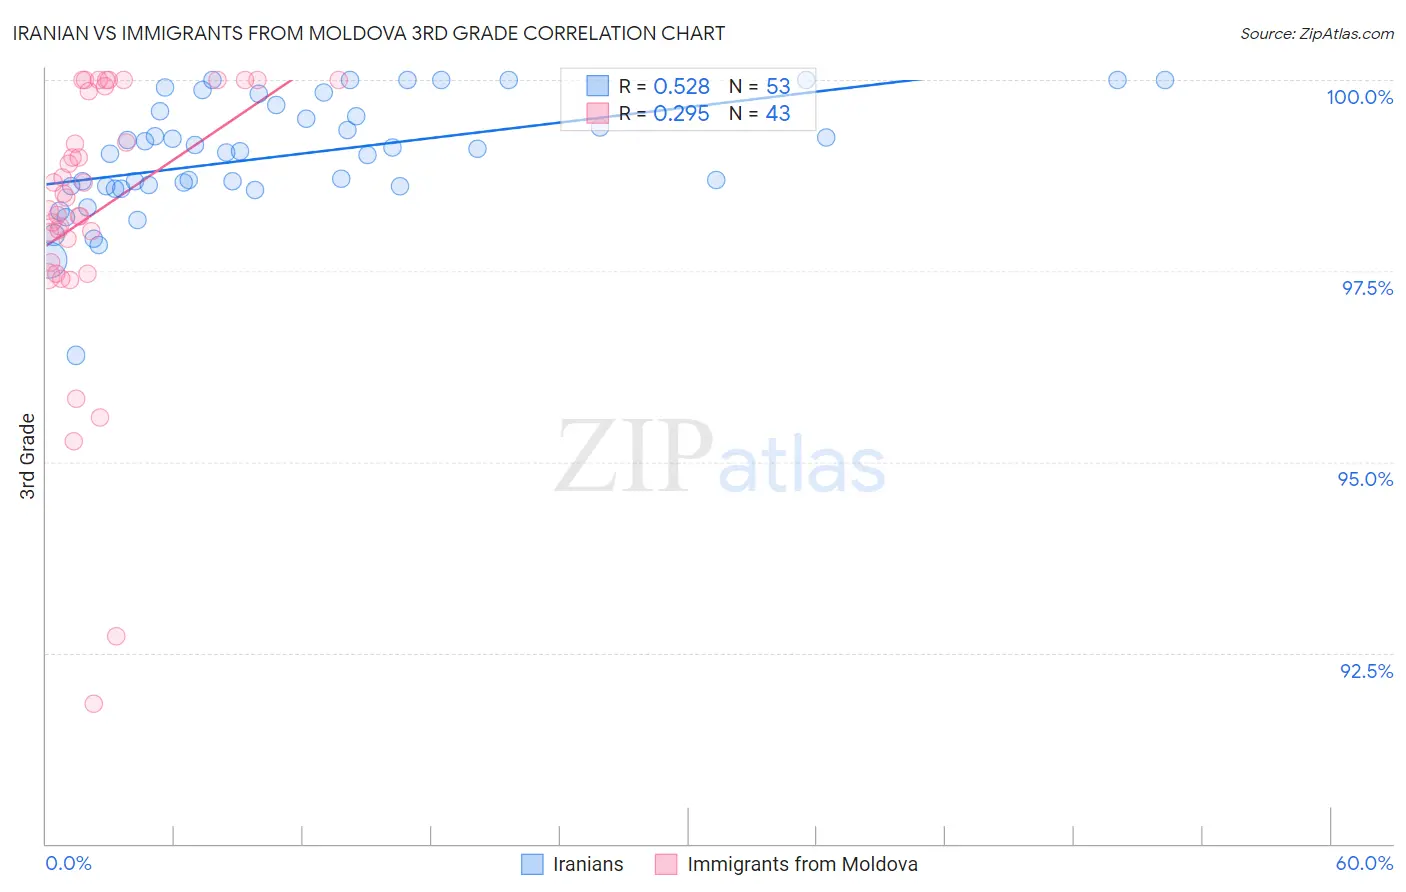
Iranian vs Immigrants from Moldova 3rd Grade Correlation Chart
The statistical analysis conducted on geographies consisting of 316,902,340 people shows a substantial positive correlation between the proportion of Iranians and percentage of population with at least 3rd grade education in the United States with a correlation coefficient (R) of 0.528 and weighted average of 98.0%. Similarly, the statistical analysis conducted on geographies consisting of 124,398,501 people shows a weak positive correlation between the proportion of Immigrants from Moldova and percentage of population with at least 3rd grade education in the United States with a correlation coefficient (R) of 0.295 and weighted average of 97.9%, a difference of 0.15%.
3rd Grade Correlation Summary
| Measurement | Iranian | Immigrants from Moldova |
| Minimum | 96.4% | 91.8% |
| Maximum | 100.0% | 100.0% |
| Range | 3.6% | 8.2% |
| Mean | 99.0% | 98.3% |
| Median | 99.1% | 98.5% |
| Interquartile 25% (IQ1) | 98.6% | 97.6% |
| Interquartile 75% (IQ3) | 99.6% | 99.9% |
| Interquartile Range (IQR) | 1.0% | 2.3% |
| Standard Deviation (Sample) | 0.75% | 1.8% |
| Standard Deviation (Population) | 0.74% | 1.8% |
Similar Demographics by 3rd Grade
Demographics Similar to Iranians by 3rd Grade
In terms of 3rd grade, the demographic groups most similar to Iranians are Immigrants from Norway (98.0%, a difference of 0.0%), Immigrants from France (98.0%, a difference of 0.0%), Spanish (98.0%, a difference of 0.0%), Thai (98.0%, a difference of 0.010%), and Menominee (98.0%, a difference of 0.010%).
| Demographics | Rating | Rank | 3rd Grade |
| Basques | 96.5 /100 | #111 | Exceptional 98.0% |
| Immigrants | Latvia | 96.0 /100 | #112 | Exceptional 98.0% |
| Thais | 95.5 /100 | #113 | Exceptional 98.0% |
| Menominee | 95.4 /100 | #114 | Exceptional 98.0% |
| Okinawans | 95.2 /100 | #115 | Exceptional 98.0% |
| Immigrants | Norway | 95.2 /100 | #116 | Exceptional 98.0% |
| Immigrants | France | 95.1 /100 | #117 | Exceptional 98.0% |
| Iranians | 94.9 /100 | #118 | Exceptional 98.0% |
| Spanish | 94.8 /100 | #119 | Exceptional 98.0% |
| Immigrants | Croatia | 94.4 /100 | #120 | Exceptional 98.0% |
| Iroquois | 94.1 /100 | #121 | Exceptional 98.0% |
| Lebanese | 94.1 /100 | #122 | Exceptional 98.0% |
| Syrians | 93.8 /100 | #123 | Exceptional 98.0% |
| Immigrants | Japan | 93.7 /100 | #124 | Exceptional 98.0% |
| Immigrants | Saudi Arabia | 93.5 /100 | #125 | Exceptional 98.0% |
Demographics Similar to Immigrants from Moldova by 3rd Grade
In terms of 3rd grade, the demographic groups most similar to Immigrants from Moldova are Immigrants from Israel (97.9%, a difference of 0.0%), Filipino (97.9%, a difference of 0.010%), Burmese (97.9%, a difference of 0.010%), Immigrants from Greece (97.9%, a difference of 0.010%), and Alsatian (97.9%, a difference of 0.010%).
| Demographics | Rating | Rank | 3rd Grade |
| Immigrants | Turkey | 83.5 /100 | #141 | Excellent 97.9% |
| Hmong | 80.3 /100 | #142 | Excellent 97.9% |
| Filipinos | 79.9 /100 | #143 | Good 97.9% |
| Burmese | 79.6 /100 | #144 | Good 97.9% |
| Immigrants | Greece | 79.5 /100 | #145 | Good 97.9% |
| Alsatians | 78.3 /100 | #146 | Good 97.9% |
| Immigrants | Israel | 77.3 /100 | #147 | Good 97.9% |
| Immigrants | Moldova | 77.1 /100 | #148 | Good 97.9% |
| Immigrants | North Macedonia | 74.5 /100 | #149 | Good 97.8% |
| Jordanians | 74.5 /100 | #150 | Good 97.8% |
| Soviet Union | 72.6 /100 | #151 | Good 97.8% |
| Immigrants | South Central Asia | 69.5 /100 | #152 | Good 97.8% |
| Apache | 68.5 /100 | #153 | Good 97.8% |
| Immigrants | Eastern Europe | 64.1 /100 | #154 | Good 97.8% |
| Bermudans | 62.6 /100 | #155 | Good 97.8% |