Immigrants from Northern Europe vs Norwegian Master's Degree
COMPARE
Immigrants from Northern Europe
Norwegian
Master's Degree
Master's Degree Comparison
Immigrants from Northern Europe
Norwegians
19.5%
MASTER'S DEGREE
100.0/ 100
METRIC RATING
35th/ 347
METRIC RANK
14.0%
MASTER'S DEGREE
13.6/ 100
METRIC RATING
219th/ 347
METRIC RANK
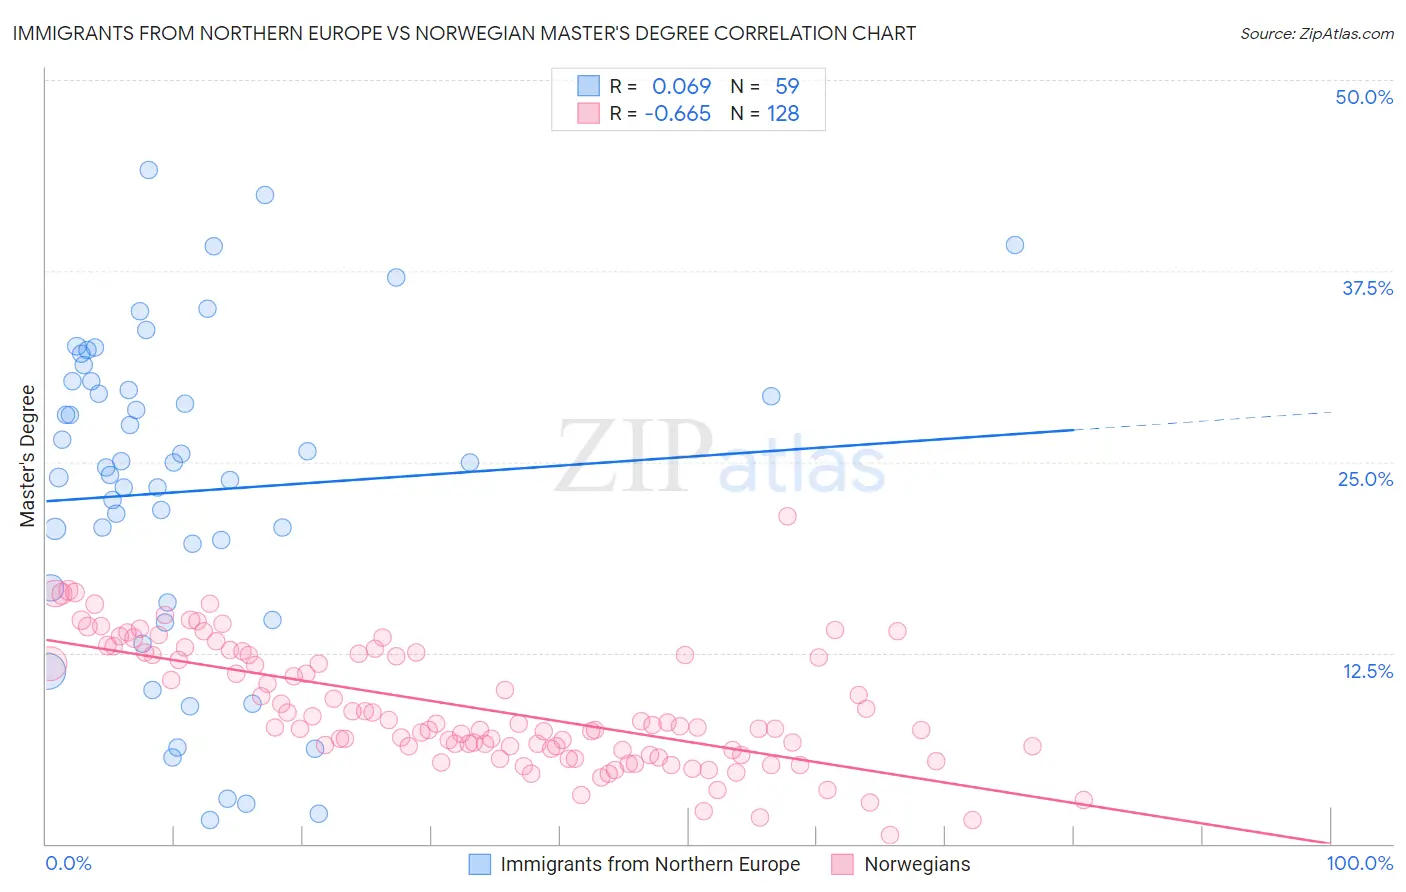
Immigrants from Northern Europe vs Norwegian Master's Degree Correlation Chart
The statistical analysis conducted on geographies consisting of 477,052,190 people shows a slight positive correlation between the proportion of Immigrants from Northern Europe and percentage of population with at least master's degree education in the United States with a correlation coefficient (R) of 0.069 and weighted average of 19.5%. Similarly, the statistical analysis conducted on geographies consisting of 532,895,610 people shows a significant negative correlation between the proportion of Norwegians and percentage of population with at least master's degree education in the United States with a correlation coefficient (R) of -0.665 and weighted average of 14.0%, a difference of 38.7%.
Master's Degree Correlation Summary
| Measurement | Immigrants from Northern Europe | Norwegian |
| Minimum | 1.5% | 0.57% |
| Maximum | 44.1% | 21.5% |
| Range | 42.6% | 20.9% |
| Mean | 23.1% | 9.0% |
| Median | 24.6% | 7.8% |
| Interquartile 25% (IQ1) | 15.8% | 6.2% |
| Interquartile 75% (IQ3) | 30.2% | 12.5% |
| Interquartile Range (IQR) | 14.4% | 6.3% |
| Standard Deviation (Sample) | 10.5% | 4.0% |
| Standard Deviation (Population) | 10.4% | 4.0% |
Similar Demographics by Master's Degree
Demographics Similar to Immigrants from Northern Europe by Master's Degree
In terms of master's degree, the demographic groups most similar to Immigrants from Northern Europe are Immigrants from Denmark (19.5%, a difference of 0.33%), Russian (19.5%, a difference of 0.36%), Immigrants from Russia (19.4%, a difference of 0.37%), Mongolian (19.4%, a difference of 0.41%), and Bolivian (19.3%, a difference of 1.1%).
| Demographics | Rating | Rank | Master's Degree |
| Turks | 100.0 /100 | #28 | Exceptional 19.9% |
| Latvians | 100.0 /100 | #29 | Exceptional 19.8% |
| Immigrants | Turkey | 100.0 /100 | #30 | Exceptional 19.7% |
| Immigrants | Korea | 100.0 /100 | #31 | Exceptional 19.7% |
| Burmese | 100.0 /100 | #32 | Exceptional 19.7% |
| Russians | 100.0 /100 | #33 | Exceptional 19.5% |
| Immigrants | Denmark | 100.0 /100 | #34 | Exceptional 19.5% |
| Immigrants | Northern Europe | 100.0 /100 | #35 | Exceptional 19.5% |
| Immigrants | Russia | 100.0 /100 | #36 | Exceptional 19.4% |
| Mongolians | 100.0 /100 | #37 | Exceptional 19.4% |
| Bolivians | 100.0 /100 | #38 | Exceptional 19.3% |
| Immigrants | Spain | 100.0 /100 | #39 | Exceptional 19.1% |
| Immigrants | Bolivia | 100.0 /100 | #40 | Exceptional 19.1% |
| Immigrants | Latvia | 100.0 /100 | #41 | Exceptional 19.1% |
| Immigrants | Saudi Arabia | 100.0 /100 | #42 | Exceptional 19.0% |
Demographics Similar to Norwegians by Master's Degree
In terms of master's degree, the demographic groups most similar to Norwegians are German (14.0%, a difference of 0.15%), Korean (14.0%, a difference of 0.29%), Ecuadorian (14.0%, a difference of 0.32%), French Canadian (14.1%, a difference of 0.35%), and Immigrants from South Eastern Asia (14.0%, a difference of 0.52%).
| Demographics | Rating | Rank | Master's Degree |
| Spanish | 17.8 /100 | #212 | Poor 14.2% |
| Immigrants | Thailand | 17.0 /100 | #213 | Poor 14.2% |
| Finns | 16.9 /100 | #214 | Poor 14.2% |
| Immigrants | Vietnam | 16.1 /100 | #215 | Poor 14.1% |
| Immigrants | Somalia | 15.8 /100 | #216 | Poor 14.1% |
| Immigrants | Trinidad and Tobago | 15.8 /100 | #217 | Poor 14.1% |
| French Canadians | 14.9 /100 | #218 | Poor 14.1% |
| Norwegians | 13.6 /100 | #219 | Poor 14.0% |
| Germans | 13.1 /100 | #220 | Poor 14.0% |
| Koreans | 12.7 /100 | #221 | Poor 14.0% |
| Ecuadorians | 12.6 /100 | #222 | Poor 14.0% |
| Immigrants | South Eastern Asia | 11.9 /100 | #223 | Poor 14.0% |
| Immigrants | Grenada | 11.8 /100 | #224 | Poor 14.0% |
| Portuguese | 11.2 /100 | #225 | Poor 13.9% |
| Immigrants | St. Vincent and the Grenadines | 11.0 /100 | #226 | Poor 13.9% |