Immigrants from Kazakhstan vs Iroquois 10th Grade
COMPARE
Immigrants from Kazakhstan
Iroquois
10th Grade
10th Grade Comparison
Immigrants from Kazakhstan
Iroquois
94.1%
10TH GRADE
84.9/ 100
METRIC RATING
144th/ 347
METRIC RANK
94.3%
10TH GRADE
92.8/ 100
METRIC RATING
129th/ 347
METRIC RANK
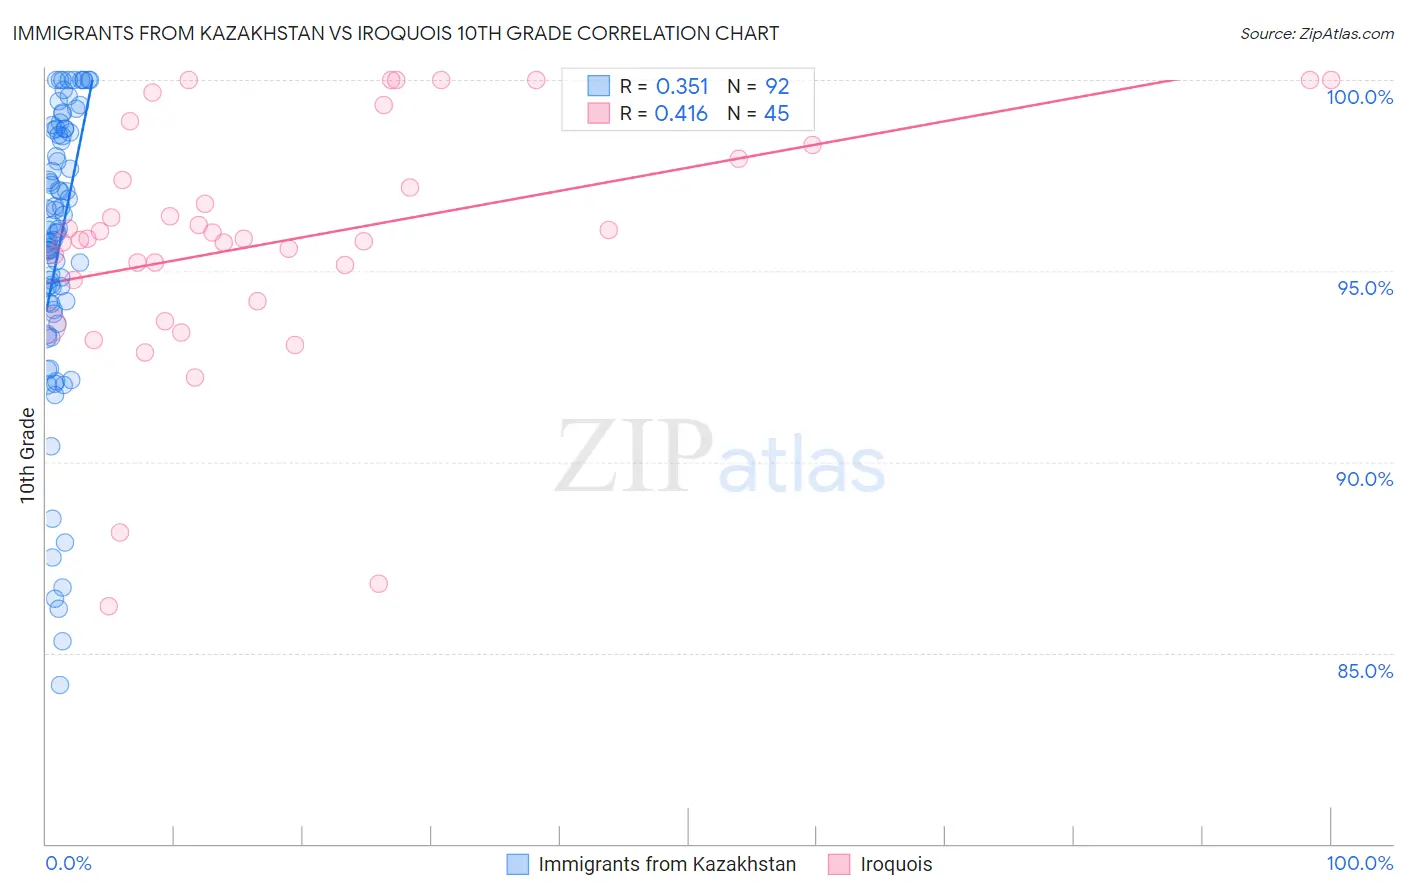
Immigrants from Kazakhstan vs Iroquois 10th Grade Correlation Chart
The statistical analysis conducted on geographies consisting of 124,444,172 people shows a mild positive correlation between the proportion of Immigrants from Kazakhstan and percentage of population with at least 10th grade education in the United States with a correlation coefficient (R) of 0.351 and weighted average of 94.1%. Similarly, the statistical analysis conducted on geographies consisting of 207,308,712 people shows a moderate positive correlation between the proportion of Iroquois and percentage of population with at least 10th grade education in the United States with a correlation coefficient (R) of 0.416 and weighted average of 94.3%, a difference of 0.18%.
10th Grade Correlation Summary
| Measurement | Immigrants from Kazakhstan | Iroquois |
| Minimum | 84.1% | 86.2% |
| Maximum | 100.0% | 100.0% |
| Range | 15.9% | 13.8% |
| Mean | 95.6% | 95.8% |
| Median | 96.0% | 95.8% |
| Interquartile 25% (IQ1) | 94.1% | 94.5% |
| Interquartile 75% (IQ3) | 98.7% | 98.1% |
| Interquartile Range (IQR) | 4.6% | 3.6% |
| Standard Deviation (Sample) | 3.7% | 3.3% |
| Standard Deviation (Population) | 3.7% | 3.2% |
Demographics Similar to Immigrants from Kazakhstan and Iroquois by 10th Grade
In terms of 10th grade, the demographic groups most similar to Immigrants from Kazakhstan are Cherokee (94.1%, a difference of 0.0%), Nonimmigrants (94.1%, a difference of 0.020%), Hmong (94.1%, a difference of 0.030%), Albanian (94.1%, a difference of 0.030%), and Chickasaw (94.1%, a difference of 0.040%). Similarly, the demographic groups most similar to Iroquois are Immigrants from Greece (94.3%, a difference of 0.0%), Immigrants from Eastern Europe (94.3%, a difference of 0.010%), Immigrants from Russia (94.3%, a difference of 0.010%), Potawatomi (94.3%, a difference of 0.030%), and Creek (94.2%, a difference of 0.030%).
| Demographics | Rating | Rank | 10th Grade |
| Immigrants | Iran | 94.4 /100 | #126 | Exceptional 94.3% |
| Israelis | 93.8 /100 | #127 | Exceptional 94.3% |
| Potawatomi | 93.6 /100 | #128 | Exceptional 94.3% |
| Iroquois | 92.8 /100 | #129 | Exceptional 94.3% |
| Immigrants | Greece | 92.7 /100 | #130 | Exceptional 94.3% |
| Immigrants | Eastern Europe | 92.5 /100 | #131 | Exceptional 94.3% |
| Immigrants | Russia | 92.4 /100 | #132 | Exceptional 94.3% |
| Creek | 91.9 /100 | #133 | Exceptional 94.2% |
| Osage | 91.7 /100 | #134 | Exceptional 94.2% |
| Immigrants | Korea | 91.3 /100 | #135 | Exceptional 94.2% |
| Shoshone | 90.8 /100 | #136 | Exceptional 94.2% |
| Arapaho | 90.5 /100 | #137 | Exceptional 94.2% |
| Immigrants | Sri Lanka | 89.9 /100 | #138 | Excellent 94.2% |
| Immigrants | Bosnia and Herzegovina | 89.4 /100 | #139 | Excellent 94.2% |
| Immigrants | Jordan | 87.6 /100 | #140 | Excellent 94.1% |
| Hmong | 86.6 /100 | #141 | Excellent 94.1% |
| Albanians | 86.5 /100 | #142 | Excellent 94.1% |
| Cherokee | 84.9 /100 | #143 | Excellent 94.1% |
| Immigrants | Kazakhstan | 84.9 /100 | #144 | Excellent 94.1% |
| Immigrants | Nonimmigrants | 83.8 /100 | #145 | Excellent 94.1% |
| Chickasaw | 82.6 /100 | #146 | Excellent 94.1% |