Indian (Asian) vs Immigrants from South America 8th Grade
COMPARE
Indian (Asian)
Immigrants from South America
8th Grade
8th Grade Comparison
Indians (Asian)
Immigrants from South America
95.2%
8TH GRADE
3.3/ 100
METRIC RATING
232nd/ 347
METRIC RANK
94.8%
8TH GRADE
0.2/ 100
METRIC RATING
272nd/ 347
METRIC RANK
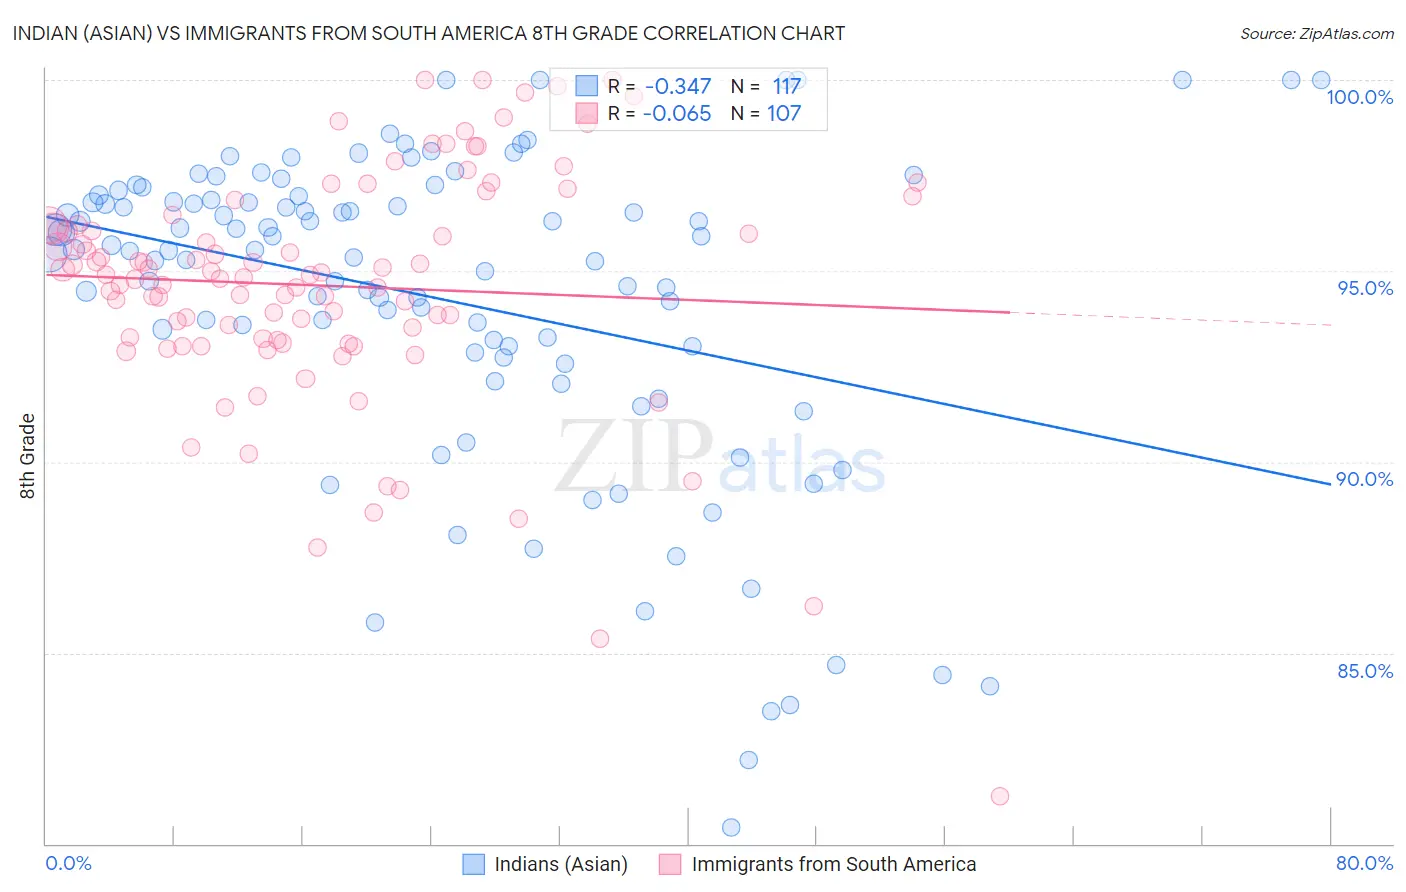
Indian (Asian) vs Immigrants from South America 8th Grade Correlation Chart
The statistical analysis conducted on geographies consisting of 495,348,182 people shows a mild negative correlation between the proportion of Indians (Asian) and percentage of population with at least 8th grade education in the United States with a correlation coefficient (R) of -0.347 and weighted average of 95.2%. Similarly, the statistical analysis conducted on geographies consisting of 486,312,594 people shows a slight negative correlation between the proportion of Immigrants from South America and percentage of population with at least 8th grade education in the United States with a correlation coefficient (R) of -0.065 and weighted average of 94.8%, a difference of 0.48%.
8th Grade Correlation Summary
| Measurement | Indian (Asian) | Immigrants from South America |
| Minimum | 80.4% | 81.2% |
| Maximum | 100.0% | 100.0% |
| Range | 19.6% | 18.8% |
| Mean | 94.3% | 94.6% |
| Median | 95.5% | 94.9% |
| Interquartile 25% (IQ1) | 92.8% | 93.2% |
| Interquartile 75% (IQ3) | 96.9% | 96.2% |
| Interquartile Range (IQR) | 4.1% | 3.0% |
| Standard Deviation (Sample) | 4.2% | 3.2% |
| Standard Deviation (Population) | 4.2% | 3.1% |
Similar Demographics by 8th Grade
Demographics Similar to Indians (Asian) by 8th Grade
In terms of 8th grade, the demographic groups most similar to Indians (Asian) are Asian (95.2%, a difference of 0.010%), Immigrants from Asia (95.2%, a difference of 0.010%), Costa Rican (95.2%, a difference of 0.020%), Nigerian (95.2%, a difference of 0.020%), and Immigrants from Panama (95.2%, a difference of 0.030%).
| Demographics | Rating | Rank | 8th Grade |
| Sub-Saharan Africans | 6.0 /100 | #225 | Tragic 95.3% |
| Navajo | 5.7 /100 | #226 | Tragic 95.3% |
| Bahamians | 5.6 /100 | #227 | Tragic 95.3% |
| Immigrants | Eastern Africa | 5.6 /100 | #228 | Tragic 95.3% |
| Immigrants | Indonesia | 4.4 /100 | #229 | Tragic 95.3% |
| Immigrants | Panama | 4.1 /100 | #230 | Tragic 95.2% |
| Asians | 3.5 /100 | #231 | Tragic 95.2% |
| Indians (Asian) | 3.3 /100 | #232 | Tragic 95.2% |
| Immigrants | Asia | 3.1 /100 | #233 | Tragic 95.2% |
| Costa Ricans | 3.0 /100 | #234 | Tragic 95.2% |
| Nigerians | 2.9 /100 | #235 | Tragic 95.2% |
| Senegalese | 2.7 /100 | #236 | Tragic 95.2% |
| Immigrants | Africa | 2.7 /100 | #237 | Tragic 95.2% |
| Natives/Alaskans | 2.3 /100 | #238 | Tragic 95.2% |
| Immigrants | Sierra Leone | 2.1 /100 | #239 | Tragic 95.1% |
Demographics Similar to Immigrants from South America by 8th Grade
In terms of 8th grade, the demographic groups most similar to Immigrants from South America are Immigrants from Western Africa (94.8%, a difference of 0.0%), Immigrants from Afghanistan (94.8%, a difference of 0.010%), Immigrants from Uzbekistan (94.8%, a difference of 0.020%), Trinidadian and Tobagonian (94.7%, a difference of 0.020%), and Immigrants from Colombia (94.7%, a difference of 0.030%).
| Demographics | Rating | Rank | 8th Grade |
| Yuman | 0.4 /100 | #265 | Tragic 94.9% |
| West Indians | 0.3 /100 | #266 | Tragic 94.8% |
| Immigrants | Ghana | 0.3 /100 | #267 | Tragic 94.8% |
| Immigrants | Uruguay | 0.3 /100 | #268 | Tragic 94.8% |
| Immigrants | Thailand | 0.2 /100 | #269 | Tragic 94.8% |
| Immigrants | Uzbekistan | 0.2 /100 | #270 | Tragic 94.8% |
| Immigrants | Afghanistan | 0.2 /100 | #271 | Tragic 94.8% |
| Immigrants | South America | 0.2 /100 | #272 | Tragic 94.8% |
| Immigrants | Western Africa | 0.2 /100 | #273 | Tragic 94.8% |
| Trinidadians and Tobagonians | 0.2 /100 | #274 | Tragic 94.7% |
| Immigrants | Colombia | 0.2 /100 | #275 | Tragic 94.7% |
| Peruvians | 0.1 /100 | #276 | Tragic 94.7% |
| Taiwanese | 0.1 /100 | #277 | Tragic 94.7% |
| Armenians | 0.1 /100 | #278 | Tragic 94.7% |
| Immigrants | Trinidad and Tobago | 0.1 /100 | #279 | Tragic 94.6% |