Indian (Asian) vs Ugandan 8th Grade

COMPARE

Indian (Asian)
Race
Ancestry
AfghanAfricanAlaska NativeAlaskan AthabascanAlbanianAleutAlsatianAmericanApacheArabArapahoArgentineanArmenianAssyrian/Chaldean/SyriacAustralianAustrianBahamianBangladeshiBarbadianBasqueBelgianBelizeanBermudanBhutaneseBlackfeetBolivianBrazilianBritishBritish West IndianBulgarianBurmeseCajunCambodianCanadianCape VerdeanCarpatho RusynCelticCentral AmericanCentral American IndianCherokeeCheyenneChickasawChileanChineseChippewaChoctawColombianColvilleComancheCosta RicanCreeCreekCroatianCrowCubanCypriotCzechCzechoslovakianDanishDelawareDominicanDutchDutch West IndianEastern EuropeanEcuadorianEgyptianEnglishEstonianEthiopianEuropeanFijianFilipinoFinnishFrenchFrench American IndianFrench CanadianGermanGerman RussianGhanaianGreekGuamanian/ChamorroGuatemalanGuyaneseHaitianHmongHonduranHopiHoumaHungarianIcelanderIndian (Asian)IndonesianInupiatIranianIraqiIrishIroquoisIsraeliItalianJamaicanJapaneseJordanianKenyanKiowaKoreanLaotianLatvianLebaneseLiberianLithuanianLumbeeLuxembourgerMacedonianMalaysianMalteseMarshalleseMenomineeMexicanMexican American IndianMongolianMoroccanNative HawaiianNavajoNepaleseNew ZealanderNicaraguanNigerianNorthern EuropeanNorwegianOkinawanOsageOttawaPaiutePakistaniPalestinianPanamanianParaguayanPennsylvania GermanPeruvianPimaPolishPortuguesePotawatomiPuebloPuerto RicanPuget Sound SalishRomanianRussianSalvadoranSamoanScandinavianScotch-IrishScottishSeminoleSenegaleseSerbianShoshoneSierra LeoneanSiouxSlavicSlovakSloveneSomaliSouth AfricanSouth AmericanSouth American IndianSoviet UnionSpaniardSpanishSpanish AmericanSpanish American IndianSri LankanSubsaharan AfricanSudaneseSwedishSwissSyrianTaiwaneseThaiTlingit-HaidaTohono O'OdhamTonganTrinidadian and TobagonianTsimshianTurkishU.S. Virgin IslanderUkrainianUruguayanUteVenezuelanVietnameseWelshWest IndianYakamaYaquiYugoslavianYumanYup'ikZimbabwean
Immigration
NonimmigrantsImmigrantsAfghanistanAfricaAlbaniaArgentinaArmeniaAsiaAustraliaAustriaBahamasBangladeshBarbadosBelarusBelgiumBelizeBoliviaBosnia and HerzegovinaBrazilBulgariaBurma/MyanmarCabo VerdeCambodiaCameroonCanadaCaribbeanCentral AmericaChileChinaColombiaCongoCosta RicaCroatiaCubaCzechoslovakiaDenmarkDominicaDominican RepublicEastern AfricaEastern AsiaEastern EuropeEcuadorEgyptEl SalvadorEnglandEritreaEthiopiaEuropeFijiFranceGermanyGhanaGreeceGrenadaGuatemalaGuyanaHaitiHondurasHong KongHungaryIndiaIndonesiaIranIraqIrelandIsraelItalyJamaicaJapanJordanKazakhstanKenyaKoreaKuwaitLaosLatin AmericaLatviaLebanonLiberiaLithuaniaMalaysiaMexicoMicronesiaMiddle AfricaMoldovaMoroccoNepalNetherlandsNicaraguaNigeriaNorth AmericaNorth MacedoniaNorthern AfricaNorthern EuropeNorwayOceaniaPakistanPanamaPeruPhilippinesPolandPortugalRomaniaRussiaSaudi ArabiaScotlandSenegalSerbiaSierra LeoneSingaporeSomaliaSouth AfricaSouth AmericaSouth Central AsiaSouth Eastern AsiaSouthern EuropeSpainSri LankaSt. Vincent and the GrenadinesSudanSwedenSwitzerlandSyriaTaiwanThailandTrinidad and TobagoTurkeyUgandaUkraineUruguayUzbekistanVenezuelaVietnamWest IndiesWestern AfricaWestern AsiaWestern EuropeYemenZaireZimbabweAzores
Ugandan
Race
Ancestry
AfghanAfricanAlaska NativeAlaskan AthabascanAlbanianAleutAlsatianAmericanApacheArabArapahoArgentineanArmenianAssyrian/Chaldean/SyriacAustralianAustrianBahamianBangladeshiBarbadianBasqueBelgianBelizeanBermudanBhutaneseBlackfeetBolivianBrazilianBritishBritish West IndianBulgarianBurmeseCajunCambodianCanadianCape VerdeanCarpatho RusynCelticCentral AmericanCentral American IndianCherokeeCheyenneChickasawChileanChineseChippewaChoctawColombianColvilleComancheCosta RicanCreeCreekCroatianCrowCubanCypriotCzechCzechoslovakianDanishDelawareDominicanDutchDutch West IndianEastern EuropeanEcuadorianEgyptianEnglishEstonianEthiopianEuropeanFijianFilipinoFinnishFrenchFrench American IndianFrench CanadianGermanGerman RussianGhanaianGreekGuamanian/ChamorroGuatemalanGuyaneseHaitianHmongHonduranHopiHoumaHungarianIcelanderIndonesianInupiatIranianIraqiIrishIroquoisIsraeliItalianJamaicanJapaneseJordanianKenyanKiowaKoreanLaotianLatvianLebaneseLiberianLithuanianLumbeeLuxembourgerMacedonianMalaysianMalteseMarshalleseMenomineeMexicanMexican American IndianMongolianMoroccanNative HawaiianNavajoNepaleseNew ZealanderNicaraguanNigerianNorthern EuropeanNorwegianOkinawanOsageOttawaPaiutePakistaniPalestinianPanamanianParaguayanPennsylvania GermanPeruvianPimaPolishPortuguesePotawatomiPuebloPuerto RicanPuget Sound SalishRomanianRussianSalvadoranSamoanScandinavianScotch-IrishScottishSeminoleSenegaleseSerbianShoshoneSierra LeoneanSiouxSlavicSlovakSloveneSomaliSouth AfricanSouth AmericanSouth American IndianSoviet UnionSpaniardSpanishSpanish AmericanSpanish American IndianSri LankanSubsaharan AfricanSudaneseSwedishSwissSyrianTaiwaneseThaiTlingit-HaidaTohono O'OdhamTonganTrinidadian and TobagonianTsimshianTurkishU.S. Virgin IslanderUgandanUkrainianUruguayanUteVenezuelanVietnameseWelshWest IndianYakamaYaquiYugoslavianYumanYup'ikZimbabwean
Immigration
NonimmigrantsImmigrantsAfghanistanAfricaAlbaniaArgentinaArmeniaAsiaAustraliaAustriaBahamasBangladeshBarbadosBelarusBelgiumBelizeBoliviaBosnia and HerzegovinaBrazilBulgariaBurma/MyanmarCabo VerdeCambodiaCameroonCanadaCaribbeanCentral AmericaChileChinaColombiaCongoCosta RicaCroatiaCubaCzechoslovakiaDenmarkDominicaDominican RepublicEastern AfricaEastern AsiaEastern EuropeEcuadorEgyptEl SalvadorEnglandEritreaEthiopiaEuropeFijiFranceGermanyGhanaGreeceGrenadaGuatemalaGuyanaHaitiHondurasHong KongHungaryIndiaIndonesiaIranIraqIrelandIsraelItalyJamaicaJapanJordanKazakhstanKenyaKoreaKuwaitLaosLatin AmericaLatviaLebanonLiberiaLithuaniaMalaysiaMexicoMicronesiaMiddle AfricaMoldovaMoroccoNepalNetherlandsNicaraguaNigeriaNorth AmericaNorth MacedoniaNorthern AfricaNorthern EuropeNorwayOceaniaPakistanPanamaPeruPhilippinesPolandPortugalRomaniaRussiaSaudi ArabiaScotlandSenegalSerbiaSierra LeoneSingaporeSomaliaSouth AfricaSouth AmericaSouth Central AsiaSouth Eastern AsiaSouthern EuropeSpainSri LankaSt. Vincent and the GrenadinesSudanSwedenSwitzerlandSyriaTaiwanThailandTrinidad and TobagoTurkeyUgandaUkraineUruguayUzbekistanVenezuelaVietnamWest IndiesWestern AfricaWestern AsiaWestern EuropeYemenZaireZimbabweAzores
8th Grade
Income
Poverty
Unemployment
Labor Participation
Family Structure
Vehicle Availability
Education Level
Disability

8th Grade Comparison

Indians (Asian)

Ugandans

Tragic
Good
95.2%
8TH GRADE
3.3/ 100
METRIC RATING
232nd/ 347
METRIC RANK
95.9%
8TH GRADE
74.1/ 100
METRIC RATING
156th/ 347
METRIC RANK

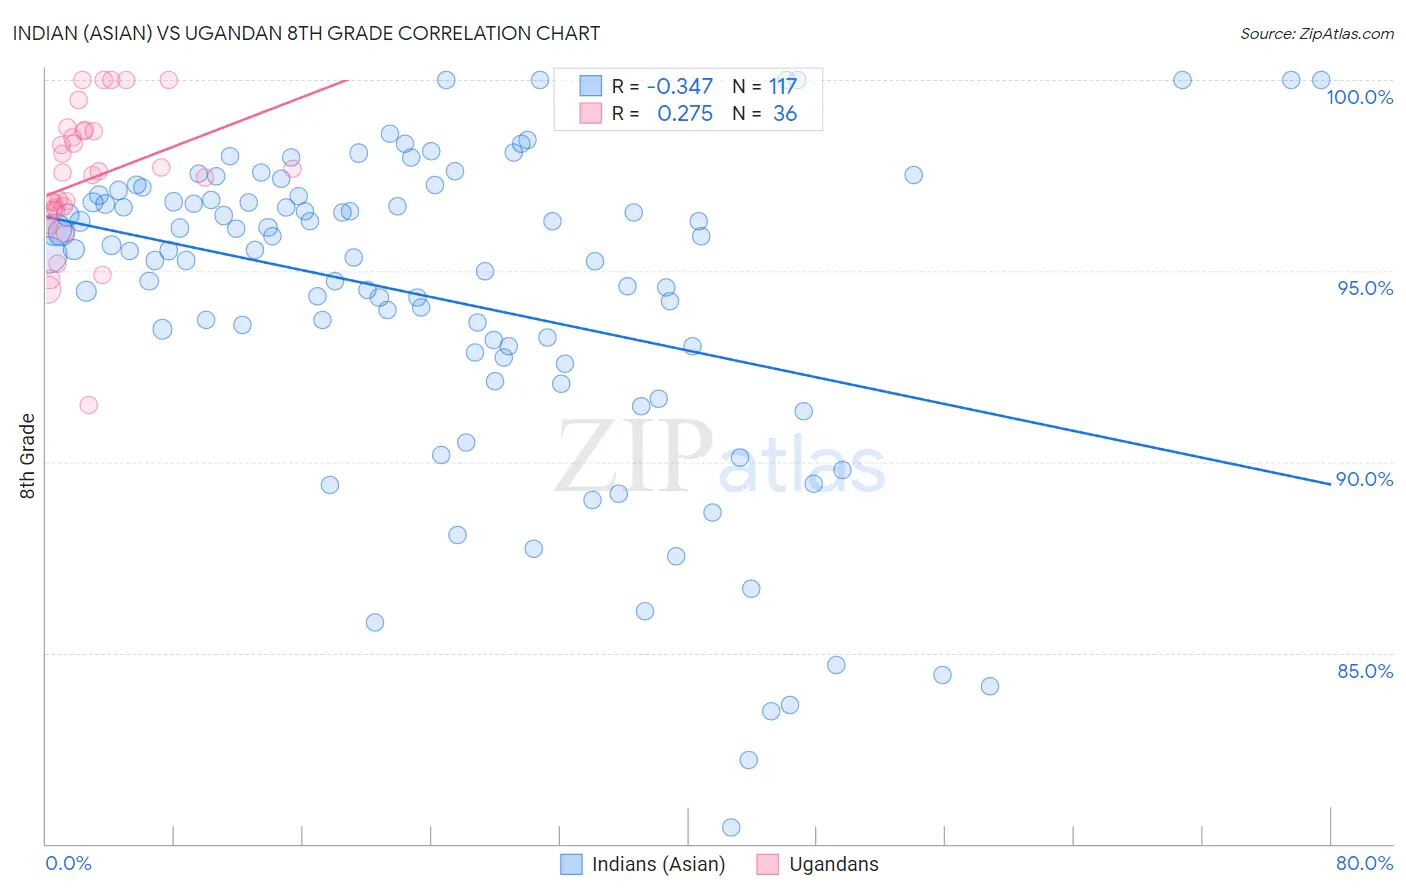
Indian (Asian) vs Ugandan 8th Grade Correlation Chart

The statistical analysis conducted on geographies consisting of 495,348,182 people shows a mild negative correlation between the proportion of Indians (Asian) and percentage of population with at least 8th grade education in the United States with a correlation coefficient (R) of -0.347 and weighted average of 95.2%. Similarly, the statistical analysis conducted on geographies consisting of 93,991,892 people shows a weak positive correlation between the proportion of Ugandans and percentage of population with at least 8th grade education in the United States with a correlation coefficient (R) of 0.275 and weighted average of 95.9%, a difference of 0.72%.
Indian (Asian) vs Ugandan 8th Grade

8th Grade Correlation Summary

MeasurementIndian (Asian)Ugandan
Minimum80.4%91.5%
Maximum100.0%100.0%
Range19.6%8.5%
Mean94.3%97.4%
Median95.5%97.5%
Interquartile 25% (IQ1)92.8%96.6%
Interquartile 75% (IQ3)96.9%98.7%
Interquartile Range (IQR)4.1%2.1%
Standard Deviation (Sample)4.2%1.8%
Standard Deviation (Population)4.2%1.8%

Similar Demographics by 8th Grade

Demographics Similar to Indians (Asian) by 8th Grade

In terms of 8th grade, the demographic groups most similar to Indians (Asian) are Asian (95.2%, a difference of 0.010%), Immigrants from Asia (95.2%, a difference of 0.010%), Costa Rican (95.2%, a difference of 0.020%), Nigerian (95.2%, a difference of 0.020%), and Immigrants from Panama (95.2%, a difference of 0.030%).
DemographicsRating | Rank8th Grade
Sub-Saharan Africans
6.0
/100
|
#225
Tragic
95.3%
Navajo
5.7
/100
|
#226
Tragic
95.3%
Bahamians
5.6
/100
|
#227
Tragic
95.3%
Immigrants | Eastern Africa
5.6
/100
|
#228
Tragic
95.3%
Immigrants | Indonesia
4.4
/100
|
#229
Tragic
95.3%
Immigrants | Panama
4.1
/100
|
#230
Tragic
95.2%
Asians
3.5
/100
|
#231
Tragic
95.2%
Indians (Asian)
3.3
/100
|
#232
Tragic
95.2%
Immigrants | Asia
3.1
/100
|
#233
Tragic
95.2%
Costa Ricans
3.0
/100
|
#234
Tragic
95.2%
Nigerians
2.9
/100
|
#235
Tragic
95.2%
Senegalese
2.7
/100
|
#236
Tragic
95.2%
Immigrants | Africa
2.7
/100
|
#237
Tragic
95.2%
Natives/Alaskans
2.3
/100
|
#238
Tragic
95.2%
Immigrants | Sierra Leone
2.1
/100
|
#239
Tragic
95.1%

Demographics Similar to Ugandans by 8th Grade

In terms of 8th grade, the demographic groups most similar to Ugandans are Kenyan (95.9%, a difference of 0.0%), Immigrants from Taiwan (95.9%, a difference of 0.030%), Arab (95.9%, a difference of 0.040%), Immigrants from Kazakhstan (95.9%, a difference of 0.040%), and Immigrants from Jordan (95.9%, a difference of 0.050%).
DemographicsRating | Rank8th Grade
Immigrants | Israel
81.3
/100
|
#149
Excellent
96.0%
Immigrants | Russia
80.9
/100
|
#150
Excellent
96.0%
Blackfeet
80.8
/100
|
#151
Excellent
96.0%
French American Indians
80.6
/100
|
#152
Excellent
96.0%
Immigrants | Jordan
79.5
/100
|
#153
Good
95.9%
Hopi
79.4
/100
|
#154
Good
95.9%
Kenyans
74.5
/100
|
#155
Good
95.9%
Ugandans
74.1
/100
|
#156
Good
95.9%
Immigrants | Taiwan
70.5
/100
|
#157
Good
95.9%
Arabs
69.4
/100
|
#158
Good
95.9%
Immigrants | Kazakhstan
68.4
/100
|
#159
Good
95.9%
Seminole
67.7
/100
|
#160
Good
95.8%
Bermudans
67.5
/100
|
#161
Good
95.8%
Immigrants | Kenya
67.2
/100
|
#162
Good
95.8%
Immigrants | Sri Lanka
64.1
/100
|
#163
Good
95.8%