Immigrants from Armenia vs Lithuanian 5th Grade
COMPARE
Immigrants from Armenia
Lithuanian
5th Grade
5th Grade Comparison
Immigrants from Armenia
Lithuanians
95.4%
5TH GRADE
0.0/ 100
METRIC RATING
330th/ 347
METRIC RANK
98.2%
5TH GRADE
100.0/ 100
METRIC RATING
20th/ 347
METRIC RANK
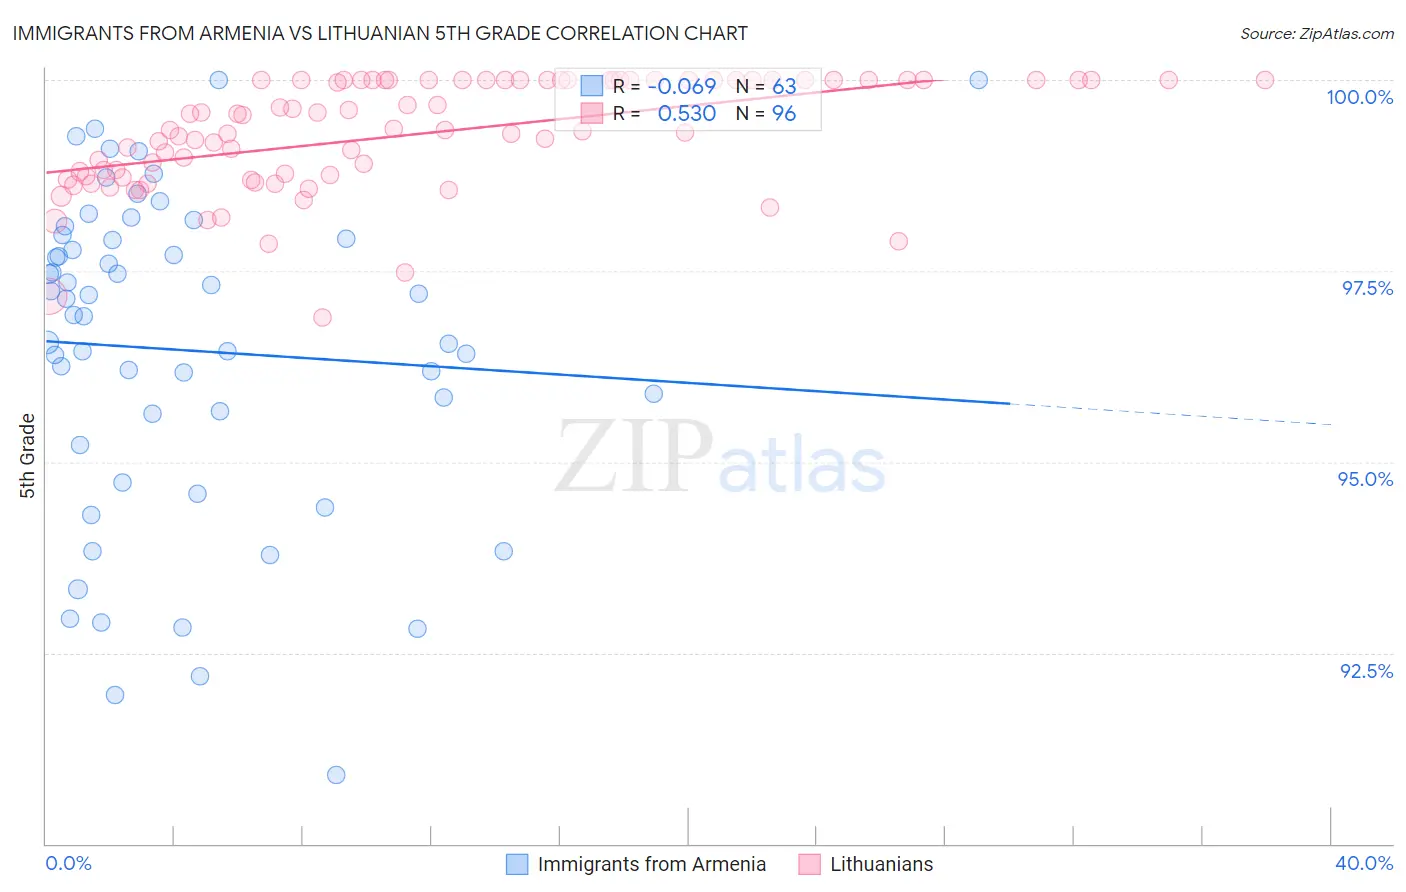
Immigrants from Armenia vs Lithuanian 5th Grade Correlation Chart
The statistical analysis conducted on geographies consisting of 97,657,339 people shows a slight negative correlation between the proportion of Immigrants from Armenia and percentage of population with at least 5th grade education in the United States with a correlation coefficient (R) of -0.069 and weighted average of 95.4%. Similarly, the statistical analysis conducted on geographies consisting of 421,946,672 people shows a substantial positive correlation between the proportion of Lithuanians and percentage of population with at least 5th grade education in the United States with a correlation coefficient (R) of 0.530 and weighted average of 98.2%, a difference of 3.0%.
5th Grade Correlation Summary
| Measurement | Immigrants from Armenia | Lithuanian |
| Minimum | 90.9% | 96.9% |
| Maximum | 100.0% | 100.0% |
| Range | 9.1% | 3.1% |
| Mean | 96.5% | 99.3% |
| Median | 96.9% | 99.3% |
| Interquartile 25% (IQ1) | 95.2% | 98.7% |
| Interquartile 75% (IQ3) | 97.9% | 100.0% |
| Interquartile Range (IQR) | 2.7% | 1.3% |
| Standard Deviation (Sample) | 2.1% | 0.73% |
| Standard Deviation (Population) | 2.1% | 0.73% |
Similar Demographics by 5th Grade
Demographics Similar to Immigrants from Armenia by 5th Grade
In terms of 5th grade, the demographic groups most similar to Immigrants from Armenia are Immigrants from Honduras (95.4%, a difference of 0.050%), Cape Verdean (95.5%, a difference of 0.10%), Mexican American Indian (95.5%, a difference of 0.10%), Immigrants from Cambodia (95.5%, a difference of 0.14%), and Dominican (95.5%, a difference of 0.14%).
| Demographics | Rating | Rank | 5th Grade |
| Immigrants | Fiji | 0.0 /100 | #323 | Tragic 95.6% |
| Hondurans | 0.0 /100 | #324 | Tragic 95.6% |
| Hispanics or Latinos | 0.0 /100 | #325 | Tragic 95.6% |
| Immigrants | Cambodia | 0.0 /100 | #326 | Tragic 95.5% |
| Dominicans | 0.0 /100 | #327 | Tragic 95.5% |
| Cape Verdeans | 0.0 /100 | #328 | Tragic 95.5% |
| Mexican American Indians | 0.0 /100 | #329 | Tragic 95.5% |
| Immigrants | Armenia | 0.0 /100 | #330 | Tragic 95.4% |
| Immigrants | Honduras | 0.0 /100 | #331 | Tragic 95.4% |
| Immigrants | Dominican Republic | 0.0 /100 | #332 | Tragic 95.3% |
| Immigrants | Latin America | 0.0 /100 | #333 | Tragic 95.3% |
| Nepalese | 0.0 /100 | #334 | Tragic 95.2% |
| Mexicans | 0.0 /100 | #335 | Tragic 95.2% |
| Immigrants | Azores | 0.0 /100 | #336 | Tragic 95.1% |
| Central Americans | 0.0 /100 | #337 | Tragic 95.1% |
Demographics Similar to Lithuanians by 5th Grade
In terms of 5th grade, the demographic groups most similar to Lithuanians are Finnish (98.2%, a difference of 0.0%), Pennsylvania German (98.3%, a difference of 0.010%), Polish (98.3%, a difference of 0.020%), Irish (98.3%, a difference of 0.020%), and Danish (98.2%, a difference of 0.020%).
| Demographics | Rating | Rank | 5th Grade |
| Tlingit-Haida | 100.0 /100 | #13 | Exceptional 98.3% |
| Dutch | 100.0 /100 | #14 | Exceptional 98.3% |
| Scottish | 100.0 /100 | #15 | Exceptional 98.3% |
| Poles | 100.0 /100 | #16 | Exceptional 98.3% |
| Irish | 100.0 /100 | #17 | Exceptional 98.3% |
| Pennsylvania Germans | 100.0 /100 | #18 | Exceptional 98.3% |
| Finns | 100.0 /100 | #19 | Exceptional 98.2% |
| Lithuanians | 100.0 /100 | #20 | Exceptional 98.2% |
| Danes | 100.0 /100 | #21 | Exceptional 98.2% |
| Croatians | 100.0 /100 | #22 | Exceptional 98.2% |
| Sioux | 100.0 /100 | #23 | Exceptional 98.2% |
| Scotch-Irish | 100.0 /100 | #24 | Exceptional 98.2% |
| Yup'ik | 100.0 /100 | #25 | Exceptional 98.2% |
| Alaska Natives | 100.0 /100 | #26 | Exceptional 98.2% |
| French | 100.0 /100 | #27 | Exceptional 98.2% |