Iroquois vs Pakistani 6th Grade
COMPARE
Iroquois
Pakistani
6th Grade
6th Grade Comparison
Iroquois
Pakistanis
97.4%
6TH GRADE
96.9/ 100
METRIC RATING
111th/ 347
METRIC RANK
97.0%
6TH GRADE
46.0/ 100
METRIC RATING
178th/ 347
METRIC RANK
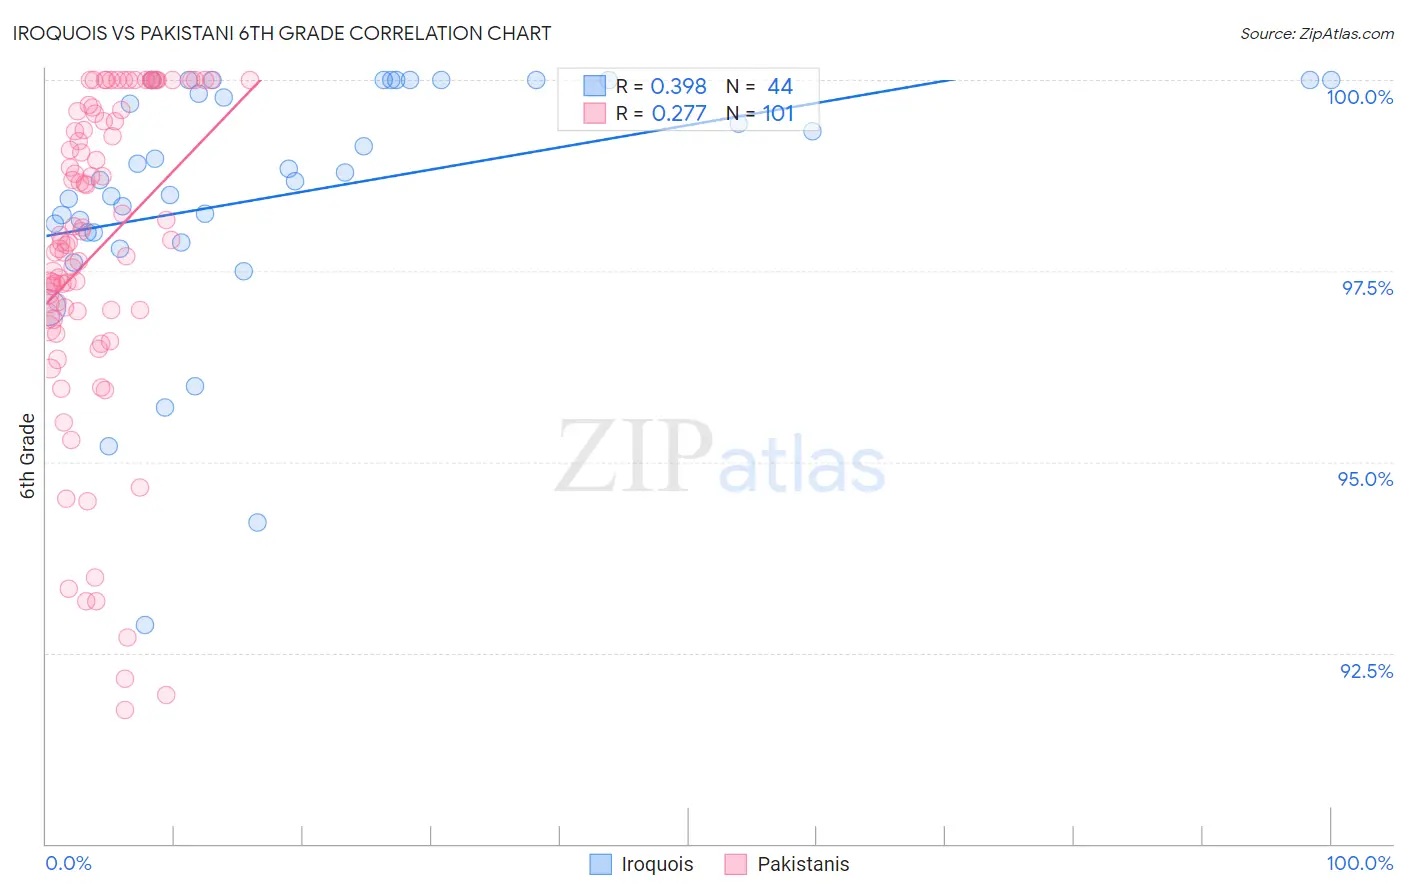
Iroquois vs Pakistani 6th Grade Correlation Chart
The statistical analysis conducted on geographies consisting of 207,308,056 people shows a mild positive correlation between the proportion of Iroquois and percentage of population with at least 6th grade education in the United States with a correlation coefficient (R) of 0.398 and weighted average of 97.4%. Similarly, the statistical analysis conducted on geographies consisting of 335,355,370 people shows a weak positive correlation between the proportion of Pakistanis and percentage of population with at least 6th grade education in the United States with a correlation coefficient (R) of 0.277 and weighted average of 97.0%, a difference of 0.41%.
6th Grade Correlation Summary
| Measurement | Iroquois | Pakistani |
| Minimum | 92.9% | 91.8% |
| Maximum | 100.0% | 100.0% |
| Range | 7.1% | 8.2% |
| Mean | 98.5% | 97.8% |
| Median | 98.7% | 97.9% |
| Interquartile 25% (IQ1) | 98.0% | 96.9% |
| Interquartile 75% (IQ3) | 100.0% | 99.6% |
| Interquartile Range (IQR) | 2.0% | 2.7% |
| Standard Deviation (Sample) | 1.6% | 2.1% |
| Standard Deviation (Population) | 1.6% | 2.1% |
Similar Demographics by 6th Grade
Demographics Similar to Iroquois by 6th Grade
In terms of 6th grade, the demographic groups most similar to Iroquois are Thai (97.4%, a difference of 0.0%), Immigrants from Latvia (97.4%, a difference of 0.010%), Immigrants from Saudi Arabia (97.4%, a difference of 0.010%), Nonimmigrants (97.4%, a difference of 0.020%), and Immigrants from Czechoslovakia (97.4%, a difference of 0.020%).
| Demographics | Rating | Rank | 6th Grade |
| German Russians | 97.9 /100 | #104 | Exceptional 97.5% |
| Cheyenne | 97.9 /100 | #105 | Exceptional 97.5% |
| Menominee | 97.7 /100 | #106 | Exceptional 97.5% |
| Immigrants | Singapore | 97.6 /100 | #107 | Exceptional 97.5% |
| Immigrants | Nonimmigrants | 97.3 /100 | #108 | Exceptional 97.4% |
| Immigrants | Czechoslovakia | 97.3 /100 | #109 | Exceptional 97.4% |
| Thais | 96.9 /100 | #110 | Exceptional 97.4% |
| Iroquois | 96.9 /100 | #111 | Exceptional 97.4% |
| Immigrants | Latvia | 96.7 /100 | #112 | Exceptional 97.4% |
| Immigrants | Saudi Arabia | 96.5 /100 | #113 | Exceptional 97.4% |
| Colville | 96.4 /100 | #114 | Exceptional 97.4% |
| Immigrants | Switzerland | 95.7 /100 | #115 | Exceptional 97.4% |
| Lebanese | 95.5 /100 | #116 | Exceptional 97.4% |
| Basques | 95.4 /100 | #117 | Exceptional 97.4% |
| Immigrants | Japan | 95.2 /100 | #118 | Exceptional 97.4% |
Demographics Similar to Pakistanis by 6th Grade
In terms of 6th grade, the demographic groups most similar to Pakistanis are Mongolian (97.0%, a difference of 0.0%), Immigrants from Kenya (97.0%, a difference of 0.0%), Immigrants from Kazakhstan (97.0%, a difference of 0.010%), Immigrants from Micronesia (97.0%, a difference of 0.010%), and Egyptian (97.1%, a difference of 0.020%).
| Demographics | Rating | Rank | 6th Grade |
| Immigrants | Sri Lanka | 51.7 /100 | #171 | Average 97.1% |
| Egyptians | 50.9 /100 | #172 | Average 97.1% |
| Arabs | 50.1 /100 | #173 | Average 97.0% |
| Venezuelans | 50.0 /100 | #174 | Average 97.0% |
| Immigrants | Kazakhstan | 47.3 /100 | #175 | Average 97.0% |
| Immigrants | Micronesia | 47.1 /100 | #176 | Average 97.0% |
| Mongolians | 46.7 /100 | #177 | Average 97.0% |
| Pakistanis | 46.0 /100 | #178 | Average 97.0% |
| Immigrants | Kenya | 45.3 /100 | #179 | Average 97.0% |
| Immigrants | Spain | 39.9 /100 | #180 | Fair 97.0% |
| Comanche | 37.9 /100 | #181 | Fair 97.0% |
| Immigrants | Ukraine | 35.6 /100 | #182 | Fair 97.0% |
| Immigrants | Venezuela | 34.5 /100 | #183 | Fair 97.0% |
| Spanish Americans | 33.5 /100 | #184 | Fair 97.0% |
| Argentineans | 33.0 /100 | #185 | Fair 97.0% |