Immigrants from Zimbabwe vs Immigrants from Singapore 3rd Grade
COMPARE
Immigrants from Zimbabwe
Immigrants from Singapore
3rd Grade
3rd Grade Comparison
Immigrants from Zimbabwe
Immigrants from Singapore
98.0%
3RD GRADE
93.4/ 100
METRIC RATING
126th/ 347
METRIC RANK
98.0%
3RD GRADE
96.7/ 100
METRIC RATING
108th/ 347
METRIC RANK
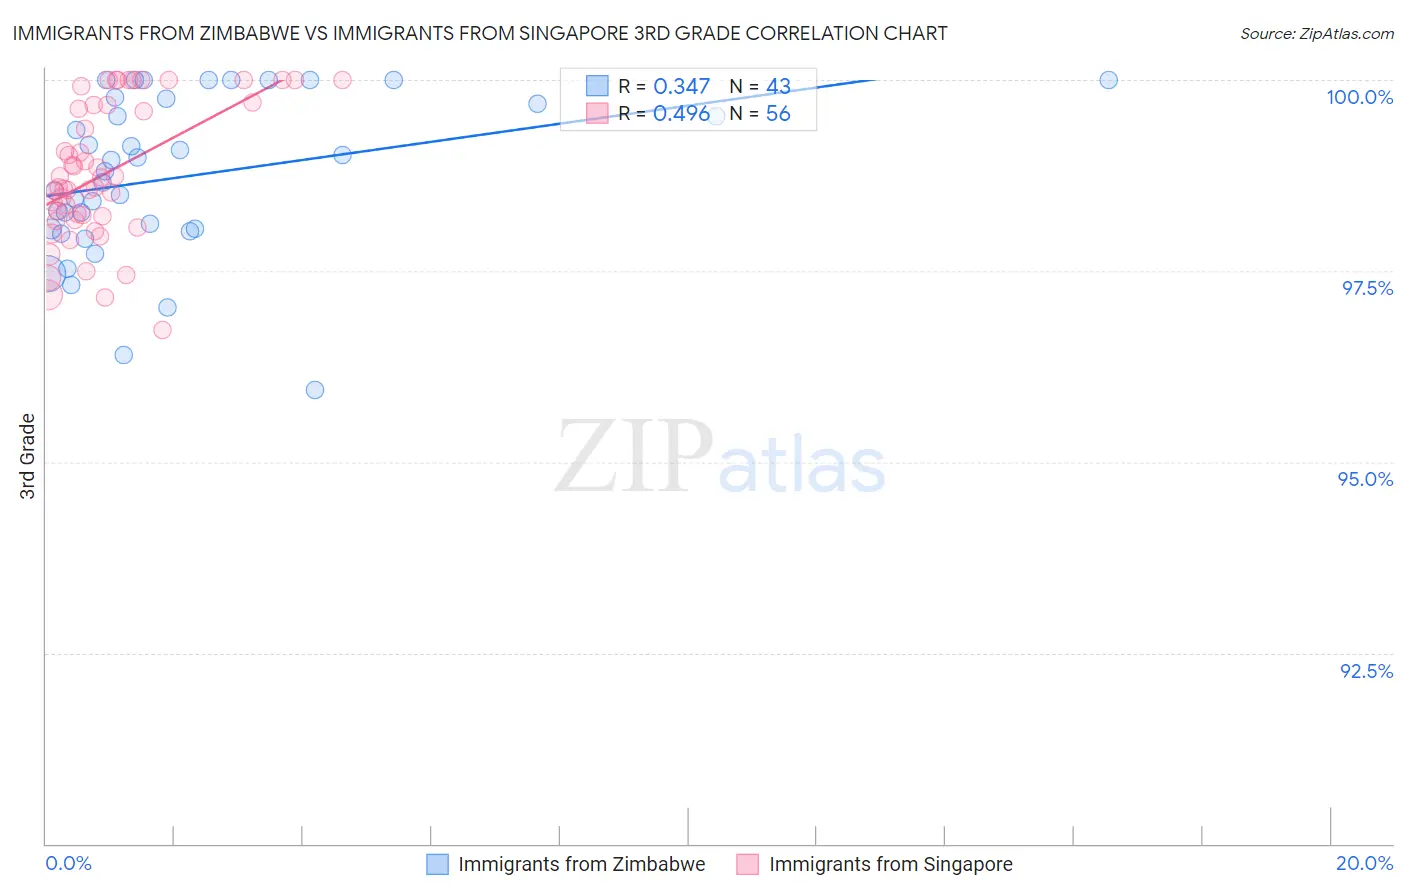
Immigrants from Zimbabwe vs Immigrants from Singapore 3rd Grade Correlation Chart
The statistical analysis conducted on geographies consisting of 117,756,150 people shows a mild positive correlation between the proportion of Immigrants from Zimbabwe and percentage of population with at least 3rd grade education in the United States with a correlation coefficient (R) of 0.347 and weighted average of 98.0%. Similarly, the statistical analysis conducted on geographies consisting of 137,521,094 people shows a moderate positive correlation between the proportion of Immigrants from Singapore and percentage of population with at least 3rd grade education in the United States with a correlation coefficient (R) of 0.496 and weighted average of 98.0%, a difference of 0.060%.
3rd Grade Correlation Summary
| Measurement | Immigrants from Zimbabwe | Immigrants from Singapore |
| Minimum | 95.9% | 96.7% |
| Maximum | 100.0% | 100.0% |
| Range | 4.1% | 3.3% |
| Mean | 98.7% | 98.8% |
| Median | 98.8% | 98.7% |
| Interquartile 25% (IQ1) | 98.1% | 98.2% |
| Interquartile 75% (IQ3) | 99.7% | 99.7% |
| Interquartile Range (IQR) | 1.7% | 1.5% |
| Standard Deviation (Sample) | 1.0% | 0.89% |
| Standard Deviation (Population) | 1.0% | 0.88% |
Demographics Similar to Immigrants from Zimbabwe and Immigrants from Singapore by 3rd Grade
In terms of 3rd grade, the demographic groups most similar to Immigrants from Zimbabwe are Immigrants from Japan (98.0%, a difference of 0.0%), Immigrants from Saudi Arabia (98.0%, a difference of 0.0%), Ute (98.0%, a difference of 0.0%), Immigrants from Croatia (98.0%, a difference of 0.010%), and Iroquois (98.0%, a difference of 0.010%). Similarly, the demographic groups most similar to Immigrants from Singapore are Pima (98.0%, a difference of 0.0%), Immigrants from Switzerland (98.0%, a difference of 0.0%), Immigrants from Czechoslovakia (98.0%, a difference of 0.010%), Basque (98.0%, a difference of 0.010%), and Immigrants from Latvia (98.0%, a difference of 0.020%).
| Demographics | Rating | Rank | 3rd Grade |
| Immigrants | Czechoslovakia | 97.0 /100 | #107 | Exceptional 98.0% |
| Immigrants | Singapore | 96.7 /100 | #108 | Exceptional 98.0% |
| Pima | 96.7 /100 | #109 | Exceptional 98.0% |
| Immigrants | Switzerland | 96.6 /100 | #110 | Exceptional 98.0% |
| Basques | 96.5 /100 | #111 | Exceptional 98.0% |
| Immigrants | Latvia | 96.0 /100 | #112 | Exceptional 98.0% |
| Thais | 95.5 /100 | #113 | Exceptional 98.0% |
| Menominee | 95.4 /100 | #114 | Exceptional 98.0% |
| Okinawans | 95.2 /100 | #115 | Exceptional 98.0% |
| Immigrants | Norway | 95.2 /100 | #116 | Exceptional 98.0% |
| Immigrants | France | 95.1 /100 | #117 | Exceptional 98.0% |
| Iranians | 94.9 /100 | #118 | Exceptional 98.0% |
| Spanish | 94.8 /100 | #119 | Exceptional 98.0% |
| Immigrants | Croatia | 94.4 /100 | #120 | Exceptional 98.0% |
| Iroquois | 94.1 /100 | #121 | Exceptional 98.0% |
| Lebanese | 94.1 /100 | #122 | Exceptional 98.0% |
| Syrians | 93.8 /100 | #123 | Exceptional 98.0% |
| Immigrants | Japan | 93.7 /100 | #124 | Exceptional 98.0% |
| Immigrants | Saudi Arabia | 93.5 /100 | #125 | Exceptional 98.0% |
| Immigrants | Zimbabwe | 93.4 /100 | #126 | Exceptional 98.0% |
| Ute | 93.2 /100 | #127 | Exceptional 98.0% |