Immigrants from Haiti vs Immigrants from Singapore 3rd Grade
COMPARE
Immigrants from Haiti
Immigrants from Singapore
3rd Grade
3rd Grade Comparison
Immigrants from Haiti
Immigrants from Singapore
96.7%
3RD GRADE
0.0/ 100
METRIC RATING
308th/ 347
METRIC RANK
98.0%
3RD GRADE
96.7/ 100
METRIC RATING
108th/ 347
METRIC RANK
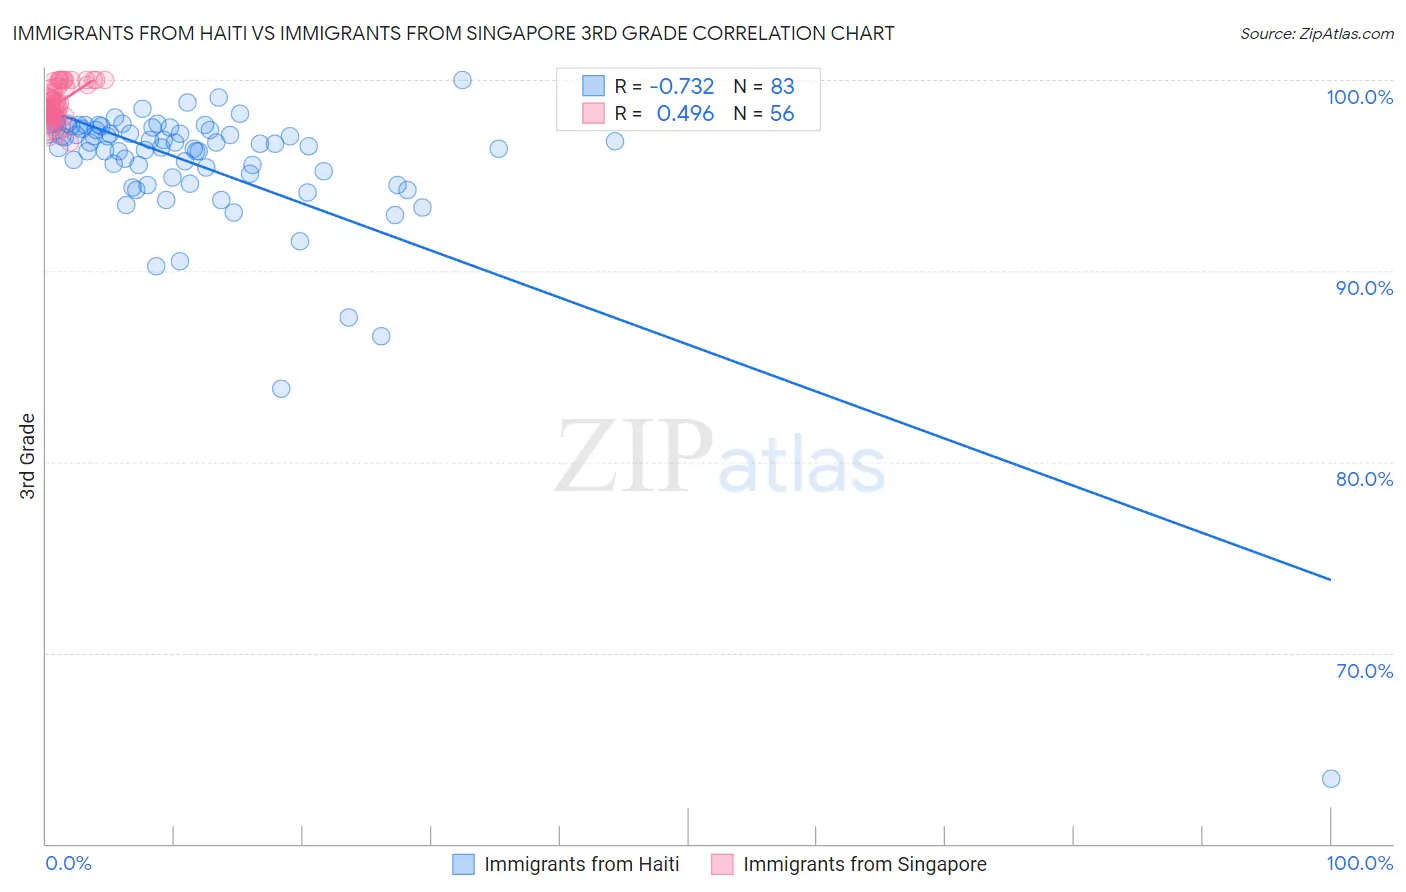
Immigrants from Haiti vs Immigrants from Singapore 3rd Grade Correlation Chart
The statistical analysis conducted on geographies consisting of 225,286,718 people shows a strong negative correlation between the proportion of Immigrants from Haiti and percentage of population with at least 3rd grade education in the United States with a correlation coefficient (R) of -0.732 and weighted average of 96.7%. Similarly, the statistical analysis conducted on geographies consisting of 137,521,094 people shows a moderate positive correlation between the proportion of Immigrants from Singapore and percentage of population with at least 3rd grade education in the United States with a correlation coefficient (R) of 0.496 and weighted average of 98.0%, a difference of 1.4%.
3rd Grade Correlation Summary
| Measurement | Immigrants from Haiti | Immigrants from Singapore |
| Minimum | 63.4% | 96.7% |
| Maximum | 100.0% | 100.0% |
| Range | 36.6% | 3.3% |
| Mean | 95.5% | 98.8% |
| Median | 96.6% | 98.7% |
| Interquartile 25% (IQ1) | 94.9% | 98.2% |
| Interquartile 75% (IQ3) | 97.5% | 99.7% |
| Interquartile Range (IQR) | 2.6% | 1.5% |
| Standard Deviation (Sample) | 4.4% | 0.89% |
| Standard Deviation (Population) | 4.4% | 0.88% |
Similar Demographics by 3rd Grade
Demographics Similar to Immigrants from Haiti by 3rd Grade
In terms of 3rd grade, the demographic groups most similar to Immigrants from Haiti are Nicaraguan (96.7%, a difference of 0.0%), Sri Lankan (96.7%, a difference of 0.0%), Guyanese (96.7%, a difference of 0.020%), Cape Verdean (96.6%, a difference of 0.030%), and Central American Indian (96.7%, a difference of 0.050%).
| Demographics | Rating | Rank | 3rd Grade |
| Immigrants | Cuba | 0.0 /100 | #301 | Tragic 96.8% |
| Immigrants | Somalia | 0.0 /100 | #302 | Tragic 96.8% |
| Ecuadorians | 0.0 /100 | #303 | Tragic 96.7% |
| Immigrants | Caribbean | 0.0 /100 | #304 | Tragic 96.7% |
| Central American Indians | 0.0 /100 | #305 | Tragic 96.7% |
| Guyanese | 0.0 /100 | #306 | Tragic 96.7% |
| Nicaraguans | 0.0 /100 | #307 | Tragic 96.7% |
| Immigrants | Haiti | 0.0 /100 | #308 | Tragic 96.7% |
| Sri Lankans | 0.0 /100 | #309 | Tragic 96.7% |
| Cape Verdeans | 0.0 /100 | #310 | Tragic 96.6% |
| Immigrants | Guyana | 0.0 /100 | #311 | Tragic 96.6% |
| Immigrants | Laos | 0.0 /100 | #312 | Tragic 96.6% |
| Immigrants | Ecuador | 0.0 /100 | #313 | Tragic 96.6% |
| Belizeans | 0.0 /100 | #314 | Tragic 96.6% |
| Immigrants | Azores | 0.0 /100 | #315 | Tragic 96.6% |
Demographics Similar to Immigrants from Singapore by 3rd Grade
In terms of 3rd grade, the demographic groups most similar to Immigrants from Singapore are Pima (98.0%, a difference of 0.0%), Immigrants from Switzerland (98.0%, a difference of 0.0%), German Russian (98.1%, a difference of 0.010%), Bhutanese (98.1%, a difference of 0.010%), and Immigrants from Czechoslovakia (98.0%, a difference of 0.010%).
| Demographics | Rating | Rank | 3rd Grade |
| Puget Sound Salish | 97.9 /100 | #101 | Exceptional 98.1% |
| Immigrants | Nonimmigrants | 97.8 /100 | #102 | Exceptional 98.1% |
| Yugoslavians | 97.7 /100 | #103 | Exceptional 98.1% |
| Turks | 97.6 /100 | #104 | Exceptional 98.1% |
| German Russians | 97.2 /100 | #105 | Exceptional 98.1% |
| Bhutanese | 97.2 /100 | #106 | Exceptional 98.1% |
| Immigrants | Czechoslovakia | 97.0 /100 | #107 | Exceptional 98.0% |
| Immigrants | Singapore | 96.7 /100 | #108 | Exceptional 98.0% |
| Pima | 96.7 /100 | #109 | Exceptional 98.0% |
| Immigrants | Switzerland | 96.6 /100 | #110 | Exceptional 98.0% |
| Basques | 96.5 /100 | #111 | Exceptional 98.0% |
| Immigrants | Latvia | 96.0 /100 | #112 | Exceptional 98.0% |
| Thais | 95.5 /100 | #113 | Exceptional 98.0% |
| Menominee | 95.4 /100 | #114 | Exceptional 98.0% |
| Okinawans | 95.2 /100 | #115 | Exceptional 98.0% |