Immigrants from Zimbabwe vs Northern European 3rd Grade
COMPARE
Immigrants from Zimbabwe
Northern European
3rd Grade
3rd Grade Comparison
Immigrants from Zimbabwe
Northern Europeans
98.0%
3RD GRADE
93.4/ 100
METRIC RATING
126th/ 347
METRIC RANK
98.3%
3RD GRADE
99.9/ 100
METRIC RATING
43rd/ 347
METRIC RANK
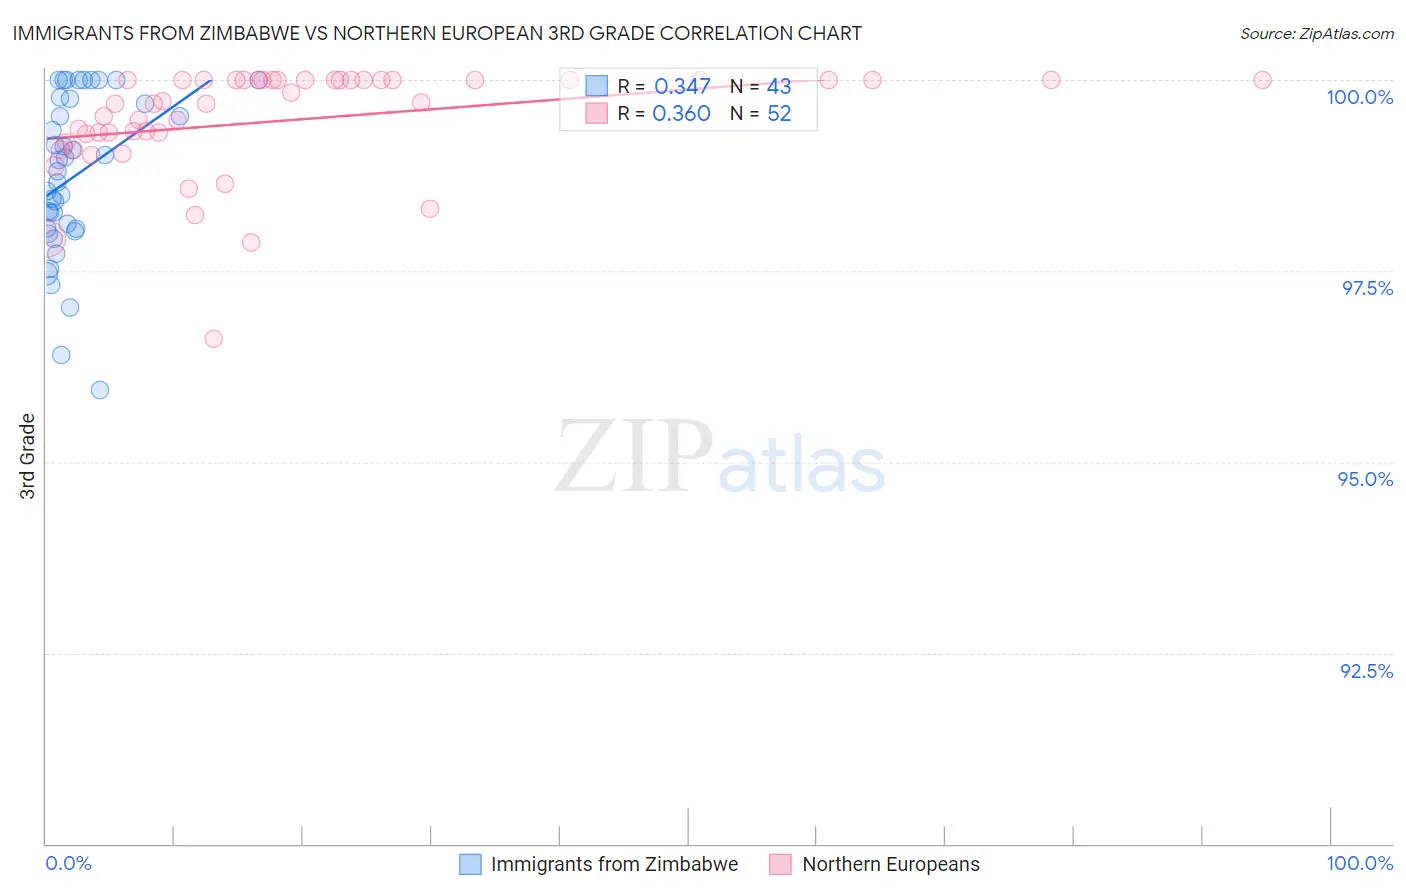
Immigrants from Zimbabwe vs Northern European 3rd Grade Correlation Chart
The statistical analysis conducted on geographies consisting of 117,756,150 people shows a mild positive correlation between the proportion of Immigrants from Zimbabwe and percentage of population with at least 3rd grade education in the United States with a correlation coefficient (R) of 0.347 and weighted average of 98.0%. Similarly, the statistical analysis conducted on geographies consisting of 406,093,361 people shows a mild positive correlation between the proportion of Northern Europeans and percentage of population with at least 3rd grade education in the United States with a correlation coefficient (R) of 0.360 and weighted average of 98.3%, a difference of 0.36%.
3rd Grade Correlation Summary
| Measurement | Immigrants from Zimbabwe | Northern European |
| Minimum | 95.9% | 96.6% |
| Maximum | 100.0% | 100.0% |
| Range | 4.1% | 3.4% |
| Mean | 98.7% | 99.5% |
| Median | 98.8% | 99.7% |
| Interquartile 25% (IQ1) | 98.1% | 99.2% |
| Interquartile 75% (IQ3) | 99.7% | 100.0% |
| Interquartile Range (IQR) | 1.7% | 0.76% |
| Standard Deviation (Sample) | 1.0% | 0.71% |
| Standard Deviation (Population) | 1.0% | 0.70% |
Similar Demographics by 3rd Grade
Demographics Similar to Immigrants from Zimbabwe by 3rd Grade
In terms of 3rd grade, the demographic groups most similar to Immigrants from Zimbabwe are Immigrants from Japan (98.0%, a difference of 0.0%), Immigrants from Saudi Arabia (98.0%, a difference of 0.0%), Ute (98.0%, a difference of 0.0%), Immigrants from Croatia (98.0%, a difference of 0.010%), and Iroquois (98.0%, a difference of 0.010%).
| Demographics | Rating | Rank | 3rd Grade |
| Spanish | 94.8 /100 | #119 | Exceptional 98.0% |
| Immigrants | Croatia | 94.4 /100 | #120 | Exceptional 98.0% |
| Iroquois | 94.1 /100 | #121 | Exceptional 98.0% |
| Lebanese | 94.1 /100 | #122 | Exceptional 98.0% |
| Syrians | 93.8 /100 | #123 | Exceptional 98.0% |
| Immigrants | Japan | 93.7 /100 | #124 | Exceptional 98.0% |
| Immigrants | Saudi Arabia | 93.5 /100 | #125 | Exceptional 98.0% |
| Immigrants | Zimbabwe | 93.4 /100 | #126 | Exceptional 98.0% |
| Ute | 93.2 /100 | #127 | Exceptional 98.0% |
| Colville | 92.1 /100 | #128 | Exceptional 98.0% |
| Immigrants | Serbia | 91.9 /100 | #129 | Exceptional 98.0% |
| Immigrants | Europe | 91.2 /100 | #130 | Exceptional 98.0% |
| Immigrants | Bulgaria | 89.1 /100 | #131 | Excellent 97.9% |
| Immigrants | Hungary | 88.8 /100 | #132 | Excellent 97.9% |
| Immigrants | Kuwait | 88.7 /100 | #133 | Excellent 97.9% |
Demographics Similar to Northern Europeans by 3rd Grade
In terms of 3rd grade, the demographic groups most similar to Northern Europeans are Luxembourger (98.3%, a difference of 0.010%), Belgian (98.3%, a difference of 0.010%), Hungarian (98.3%, a difference of 0.010%), Native Hawaiian (98.3%, a difference of 0.010%), and Eastern European (98.3%, a difference of 0.020%).
| Demographics | Rating | Rank | 3rd Grade |
| British | 99.9 /100 | #36 | Exceptional 98.4% |
| Italians | 99.9 /100 | #37 | Exceptional 98.4% |
| Chippewa | 99.9 /100 | #38 | Exceptional 98.4% |
| Latvians | 99.9 /100 | #39 | Exceptional 98.4% |
| Eastern Europeans | 99.9 /100 | #40 | Exceptional 98.3% |
| Luxembourgers | 99.9 /100 | #41 | Exceptional 98.3% |
| Belgians | 99.9 /100 | #42 | Exceptional 98.3% |
| Northern Europeans | 99.9 /100 | #43 | Exceptional 98.3% |
| Hungarians | 99.9 /100 | #44 | Exceptional 98.3% |
| Native Hawaiians | 99.9 /100 | #45 | Exceptional 98.3% |
| Ottawa | 99.8 /100 | #46 | Exceptional 98.3% |
| Czechoslovakians | 99.8 /100 | #47 | Exceptional 98.3% |
| Lumbee | 99.8 /100 | #48 | Exceptional 98.3% |
| Estonians | 99.8 /100 | #49 | Exceptional 98.3% |
| Celtics | 99.8 /100 | #50 | Exceptional 98.3% |