Immigrants from Zaire vs Spanish 4th Grade
COMPARE
Immigrants from Zaire
Spanish
4th Grade
4th Grade Comparison
Immigrants from Zaire
Spanish
97.3%
4TH GRADE
12.8/ 100
METRIC RATING
206th/ 347
METRIC RANK
97.8%
4TH GRADE
93.7/ 100
METRIC RATING
124th/ 347
METRIC RANK
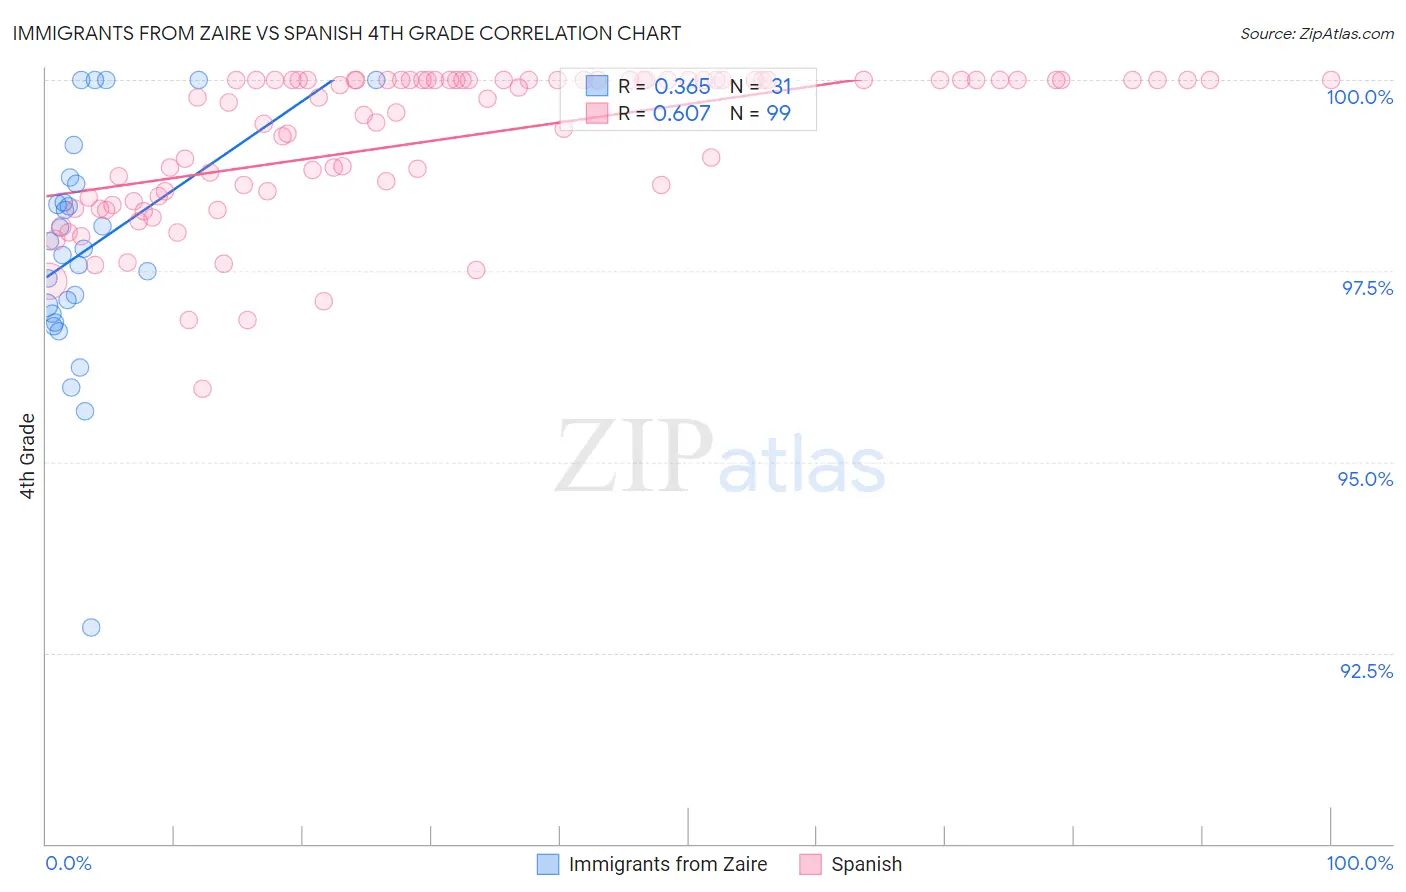
Immigrants from Zaire vs Spanish 4th Grade Correlation Chart
The statistical analysis conducted on geographies consisting of 107,212,695 people shows a mild positive correlation between the proportion of Immigrants from Zaire and percentage of population with at least 4th grade education in the United States with a correlation coefficient (R) of 0.365 and weighted average of 97.3%. Similarly, the statistical analysis conducted on geographies consisting of 422,189,210 people shows a significant positive correlation between the proportion of Spanish and percentage of population with at least 4th grade education in the United States with a correlation coefficient (R) of 0.607 and weighted average of 97.8%, a difference of 0.44%.
4th Grade Correlation Summary
| Measurement | Immigrants from Zaire | Spanish |
| Minimum | 92.8% | 96.0% |
| Maximum | 100.0% | 100.0% |
| Range | 7.2% | 4.0% |
| Mean | 97.8% | 99.2% |
| Median | 97.8% | 99.8% |
| Interquartile 25% (IQ1) | 96.9% | 98.5% |
| Interquartile 75% (IQ3) | 98.6% | 100.0% |
| Interquartile Range (IQR) | 1.7% | 1.5% |
| Standard Deviation (Sample) | 1.5% | 0.97% |
| Standard Deviation (Population) | 1.5% | 0.96% |
Similar Demographics by 4th Grade
Demographics Similar to Immigrants from Zaire by 4th Grade
In terms of 4th grade, the demographic groups most similar to Immigrants from Zaire are Paiute (97.3%, a difference of 0.0%), African (97.4%, a difference of 0.010%), Moroccan (97.3%, a difference of 0.010%), Immigrants from Northern Africa (97.4%, a difference of 0.020%), and Immigrants from Bahamas (97.3%, a difference of 0.020%).
| Demographics | Rating | Rank | 4th Grade |
| Natives/Alaskans | 20.6 /100 | #199 | Fair 97.4% |
| Immigrants | Uganda | 19.8 /100 | #200 | Poor 97.4% |
| Immigrants | Southern Europe | 16.2 /100 | #201 | Poor 97.4% |
| Immigrants | Chile | 16.1 /100 | #202 | Poor 97.4% |
| Immigrants | Northern Africa | 15.1 /100 | #203 | Poor 97.4% |
| Africans | 14.6 /100 | #204 | Poor 97.4% |
| Paiute | 13.2 /100 | #205 | Poor 97.3% |
| Immigrants | Zaire | 12.8 /100 | #206 | Poor 97.3% |
| Moroccans | 11.3 /100 | #207 | Poor 97.3% |
| Immigrants | Bahamas | 10.8 /100 | #208 | Poor 97.3% |
| Laotians | 9.3 /100 | #209 | Tragic 97.3% |
| Immigrants | Oceania | 9.1 /100 | #210 | Tragic 97.3% |
| Sudanese | 9.0 /100 | #211 | Tragic 97.3% |
| Tohono O'odham | 8.4 /100 | #212 | Tragic 97.3% |
| Costa Ricans | 8.3 /100 | #213 | Tragic 97.3% |
Demographics Similar to Spanish by 4th Grade
In terms of 4th grade, the demographic groups most similar to Spanish are Immigrants from Zimbabwe (97.8%, a difference of 0.0%), Immigrants from Norway (97.8%, a difference of 0.010%), Immigrants from Japan (97.8%, a difference of 0.010%), Syrian (97.8%, a difference of 0.020%), and Menominee (97.8%, a difference of 0.020%).
| Demographics | Rating | Rank | 4th Grade |
| Syrians | 94.9 /100 | #117 | Exceptional 97.8% |
| Menominee | 94.9 /100 | #118 | Exceptional 97.8% |
| Immigrants | Saudi Arabia | 94.8 /100 | #119 | Exceptional 97.8% |
| Immigrants | France | 94.8 /100 | #120 | Exceptional 97.8% |
| Immigrants | Norway | 94.2 /100 | #121 | Exceptional 97.8% |
| Immigrants | Japan | 94.1 /100 | #122 | Exceptional 97.8% |
| Immigrants | Zimbabwe | 93.9 /100 | #123 | Exceptional 97.8% |
| Spanish | 93.7 /100 | #124 | Exceptional 97.8% |
| Immigrants | Serbia | 92.6 /100 | #125 | Exceptional 97.8% |
| Immigrants | Europe | 92.5 /100 | #126 | Exceptional 97.8% |
| Colville | 92.3 /100 | #127 | Exceptional 97.7% |
| Pima | 92.0 /100 | #128 | Exceptional 97.7% |
| Immigrants | Bulgaria | 91.3 /100 | #129 | Exceptional 97.7% |
| Immigrants | Romania | 90.6 /100 | #130 | Exceptional 97.7% |
| Immigrants | Kuwait | 89.7 /100 | #131 | Excellent 97.7% |